Fig. 11.

Download original image
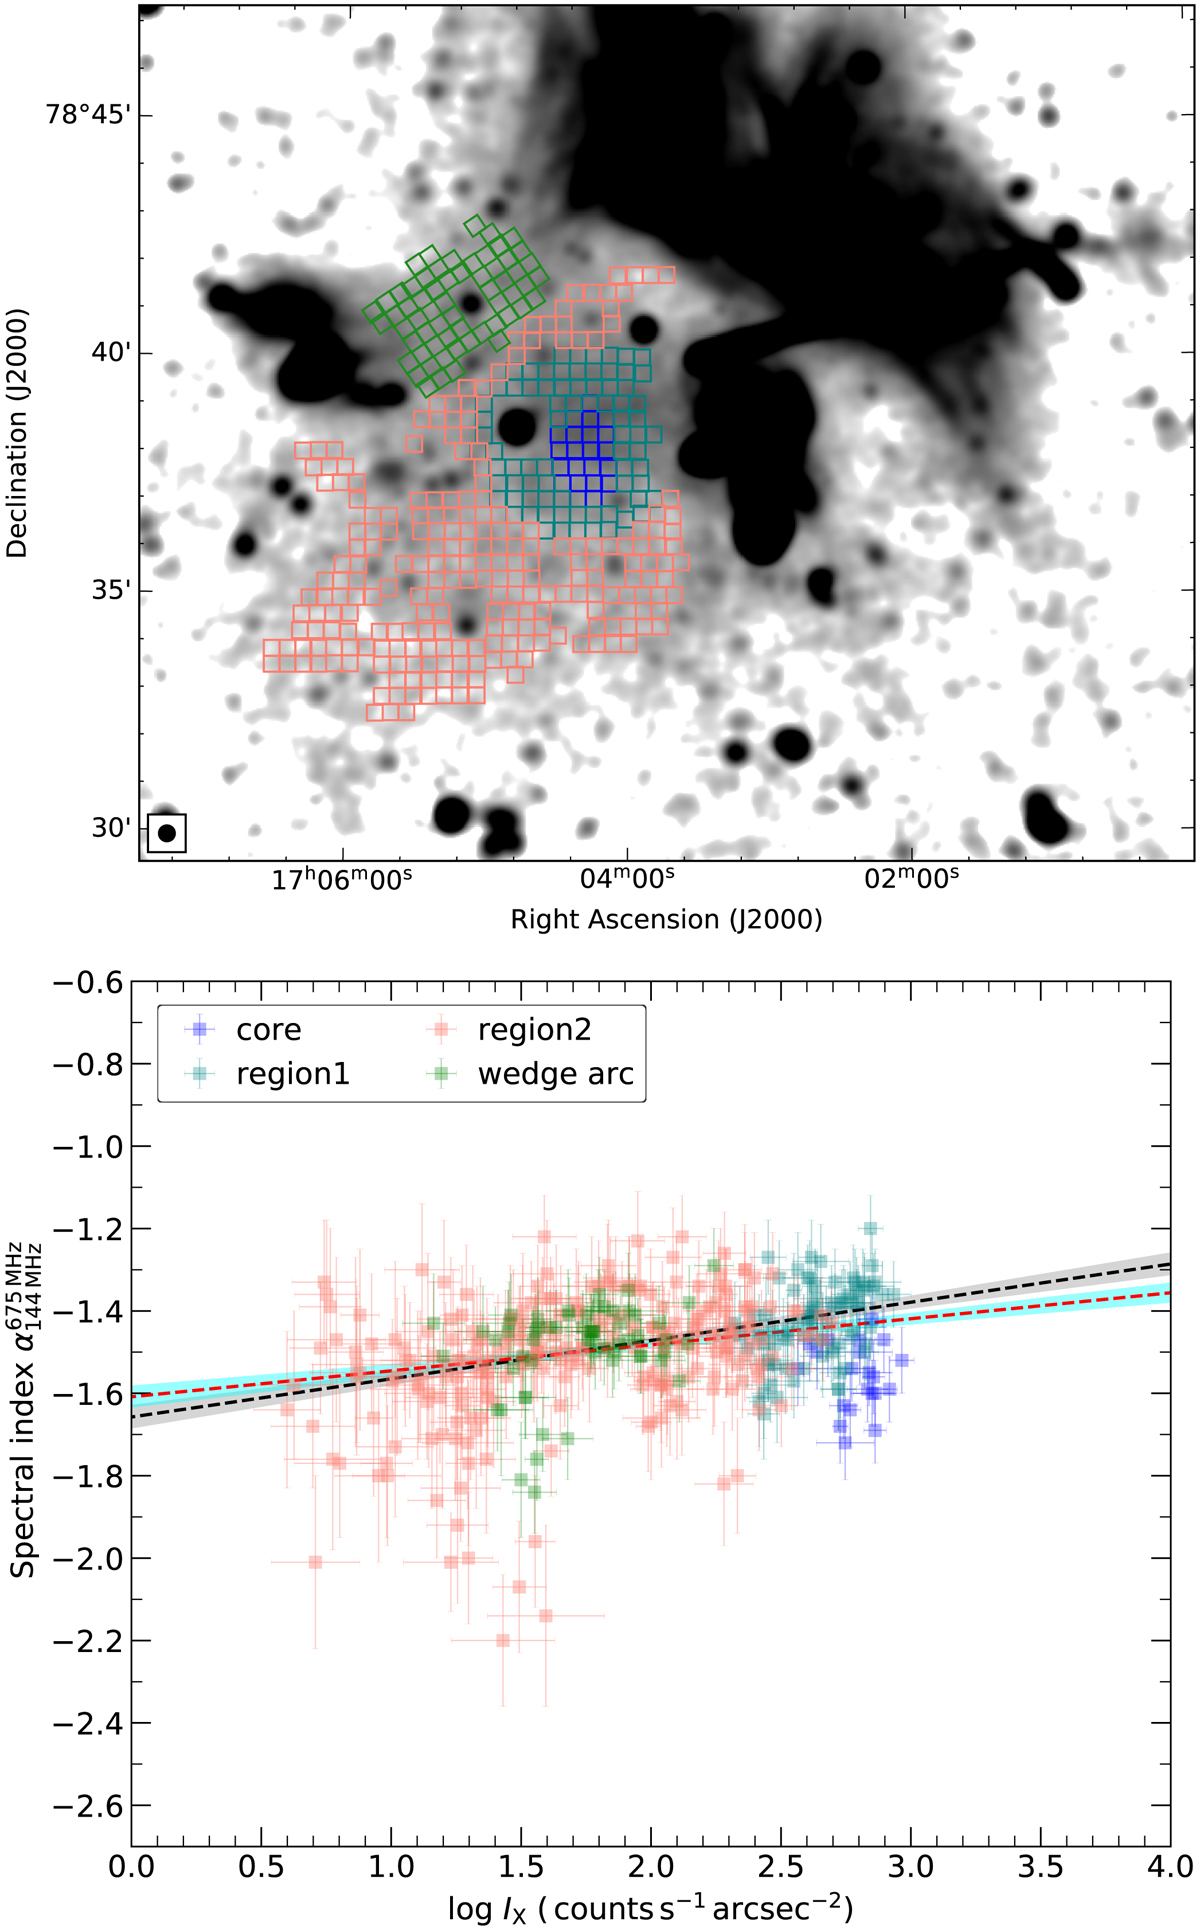
Regions used to obtain the α − IX correlation (top). The radio spectral index values were extracted between 144 MHz and 675 MHz. Each box has a width of 20″ corresponding to a physical size of about 23 kpc. The spectral index versus X-ray surface brightness relation across the halo in Abell 2256 (bottom). There is a strong anticorrelation between these two quantities (the black dashed line shows the fitting excluding the core region while the red dashed line includes the core region).
Current usage metrics show cumulative count of Article Views (full-text article views including HTML views, PDF and ePub downloads, according to the available data) and Abstracts Views on Vision4Press platform.
Data correspond to usage on the plateform after 2015. The current usage metrics is available 48-96 hours after online publication and is updated daily on week days.
Initial download of the metrics may take a while.


