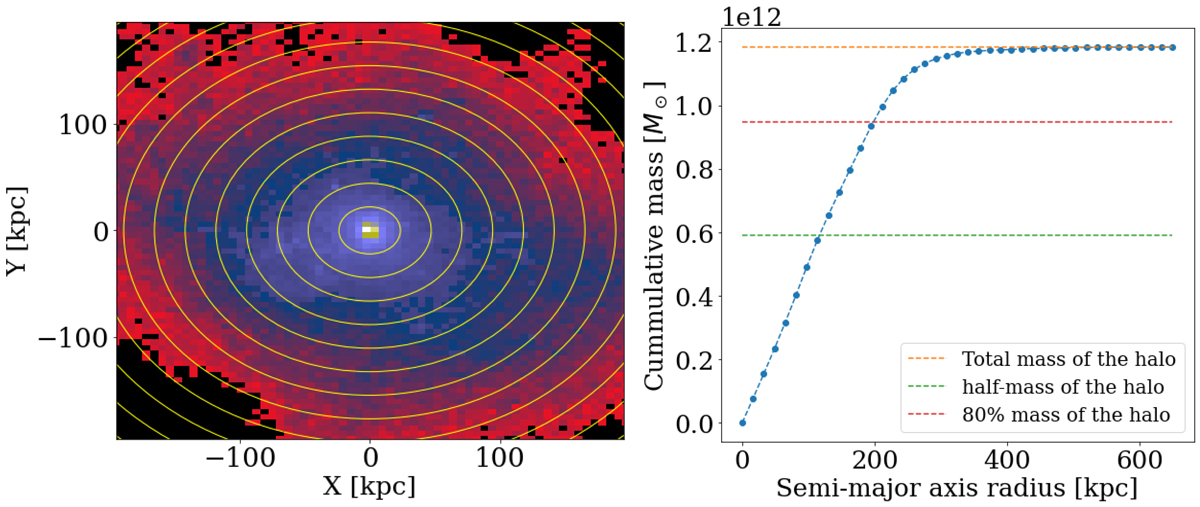
Fig. 9.
Download original image
Calculation of the mass growth curve. Left panel: projection along (X, Y) of main halo #20 of EAGLE redshift z = 0.5. Yellow ellipses represent successive concentric ellipses. Here, only one in five ellipses are displayed. Right panel: mass of the particles contained in each successive ellipse is summed to construct the cumulative halo mass curve. The green dashed line is the asymptotic value of the mass growth curve, which corresponds to the normalised total mass of the halo. The red and blue dashed lines correspond to the radii containing 20% and 80% of the total mass, respectively.
Current usage metrics show cumulative count of Article Views (full-text article views including HTML views, PDF and ePub downloads, according to the available data) and Abstracts Views on Vision4Press platform.
Data correspond to usage on the plateform after 2015. The current usage metrics is available 48-96 hours after online publication and is updated daily on week days.
Initial download of the metrics may take a while.