Fig. 4
Download original image
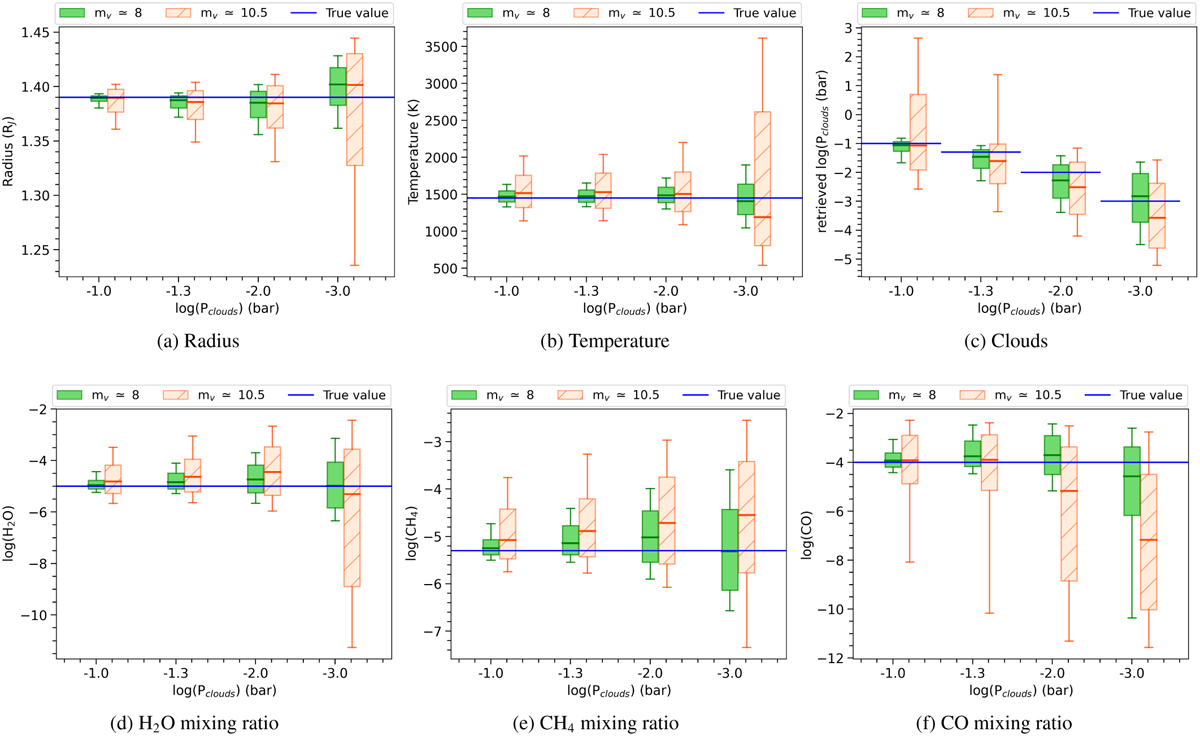
Comparison between the results obtained from the retrieval performed for the case of a hot Jupiter around an 8th magnitude G star (in green) and around a 10.5th magnitude G star (in orange) as a function of clouds pressure, assuming a mass uncertainty of about 40%. The size of the box and the error bar represent the points within 1 and 2σ of the median of the distribution (highlighted with a red and an orange solid line), respectively. Blue line is the real value.
Current usage metrics show cumulative count of Article Views (full-text article views including HTML views, PDF and ePub downloads, according to the available data) and Abstracts Views on Vision4Press platform.
Data correspond to usage on the plateform after 2015. The current usage metrics is available 48-96 hours after online publication and is updated daily on week days.
Initial download of the metrics may take a while.