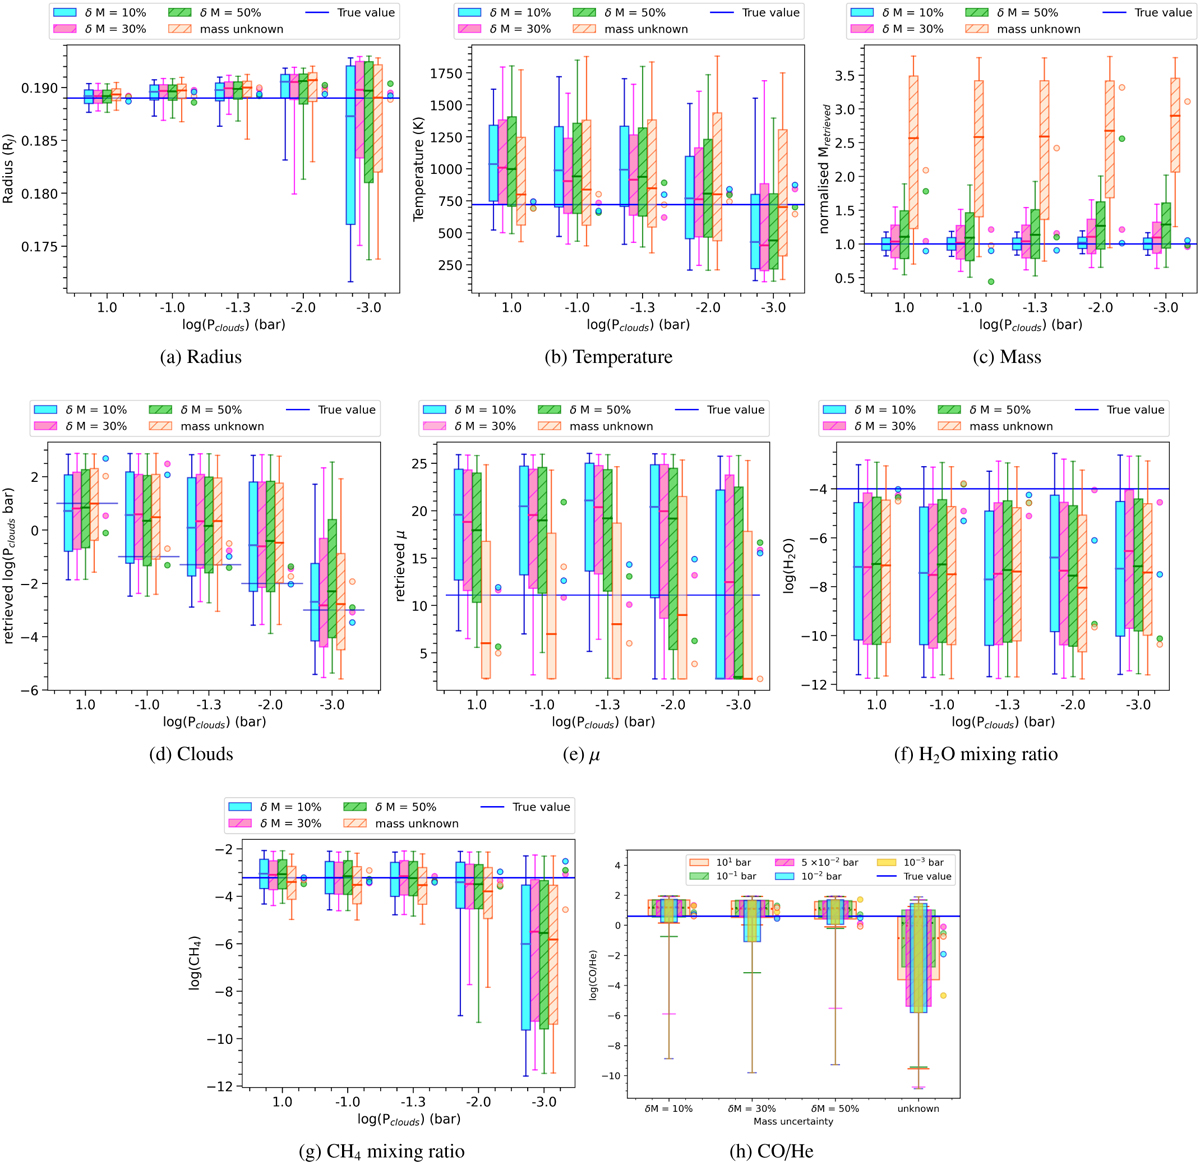
Fig. B.2
Download original image
Retrieval results obtained from different scenarios of cloudy secondary CO-dominated atmospheres in the case of μ=11.1. Differently coloured boxes represent the different mass uncertainties. Blue line highlights the true value. Points alongside the boxes highlight the MAP parameters obtained for each analysed case. The size of the box and the error bar represent the points within 1σ and 2σ of the median of the distribution (highlighted with solid lines), respectively.
Current usage metrics show cumulative count of Article Views (full-text article views including HTML views, PDF and ePub downloads, according to the available data) and Abstracts Views on Vision4Press platform.
Data correspond to usage on the plateform after 2015. The current usage metrics is available 48-96 hours after online publication and is updated daily on week days.
Initial download of the metrics may take a while.