Open Access
Fig. 9.
Download original image
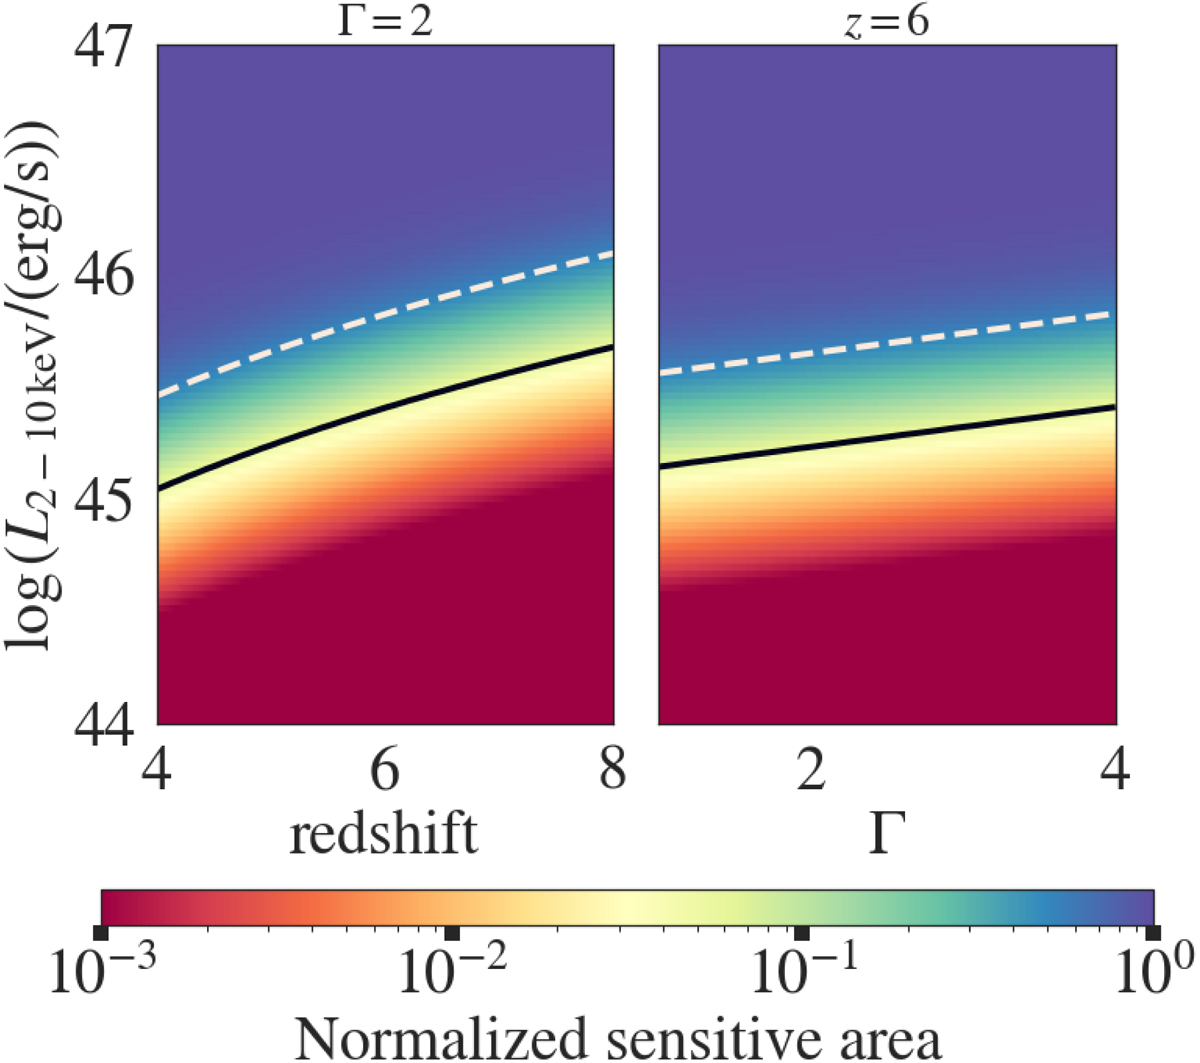
Slices of the simulated eFEDS sensitive area cube. Left: sensitive area for fixed Γ = 2 as a function of L2 − 10 keV and z. Right: sensitive area as a function of Γ and L2 − 10 keV for fixed redshift z = 6. The dotted white (solid black) line shows the parameter configurations at 50% (5%) of the normalised sensitive area.
Current usage metrics show cumulative count of Article Views (full-text article views including HTML views, PDF and ePub downloads, according to the available data) and Abstracts Views on Vision4Press platform.
Data correspond to usage on the plateform after 2015. The current usage metrics is available 48-96 hours after online publication and is updated daily on week days.
Initial download of the metrics may take a while.