Fig. A.1.
Download original image
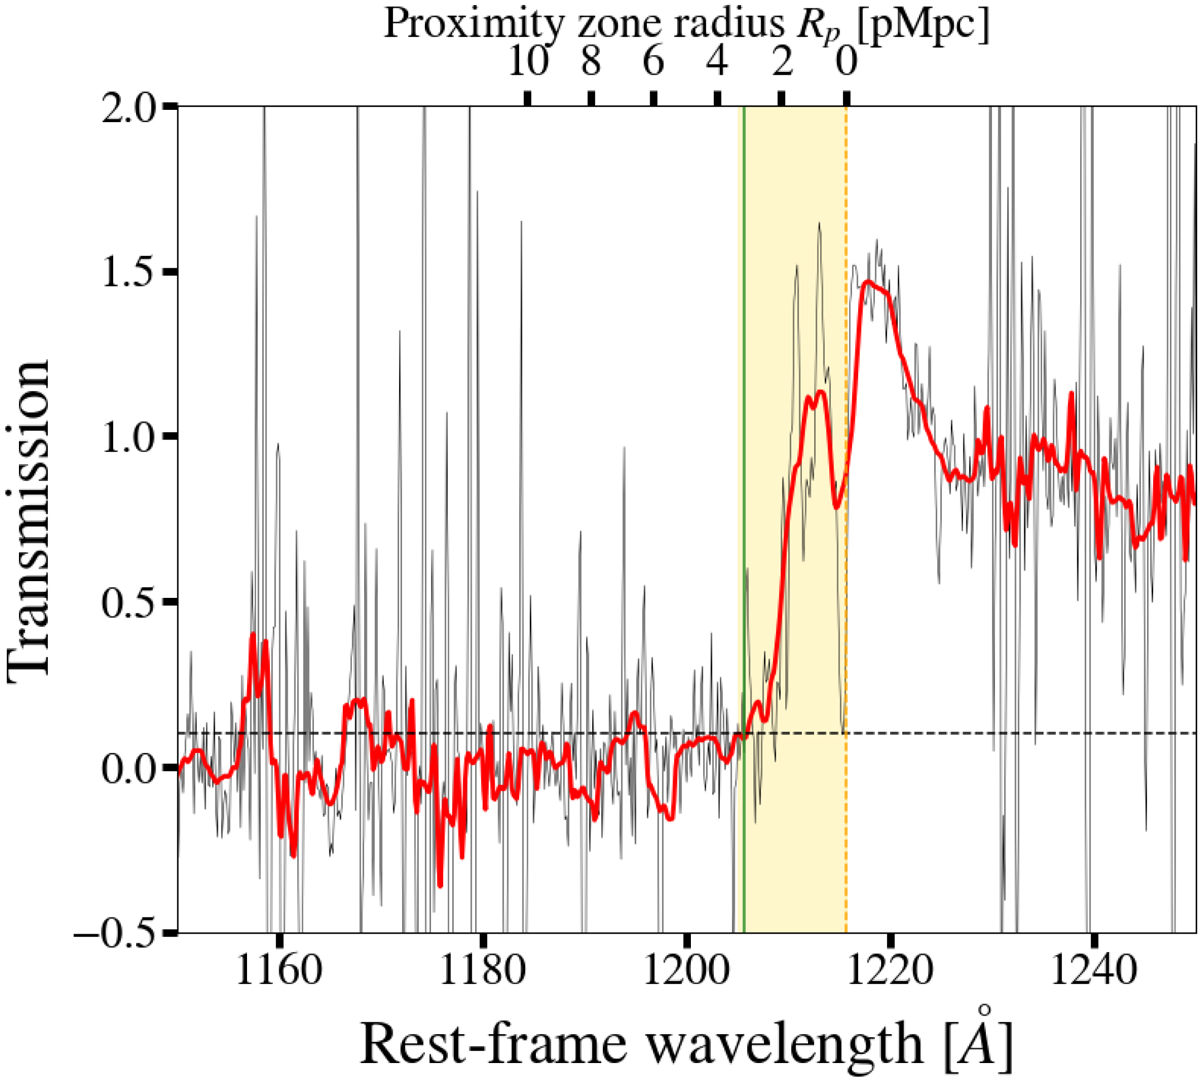
Continuum-normalised LDSS3 spectrum of J0921+0007. The size of the proximity zone is defined here as the proper distance between the rest-frame wavelength of Lyα (dashed orange line) and the wavelength where the smoothed continuum normalised flux (solid red line) first drops below 0.1% of its extrapolated value, marked here by a solid green line. The unsmoothed continuum-normalised spectrum is shown in black.
Current usage metrics show cumulative count of Article Views (full-text article views including HTML views, PDF and ePub downloads, according to the available data) and Abstracts Views on Vision4Press platform.
Data correspond to usage on the plateform after 2015. The current usage metrics is available 48-96 hours after online publication and is updated daily on week days.
Initial download of the metrics may take a while.