Fig. 7.
Download original image
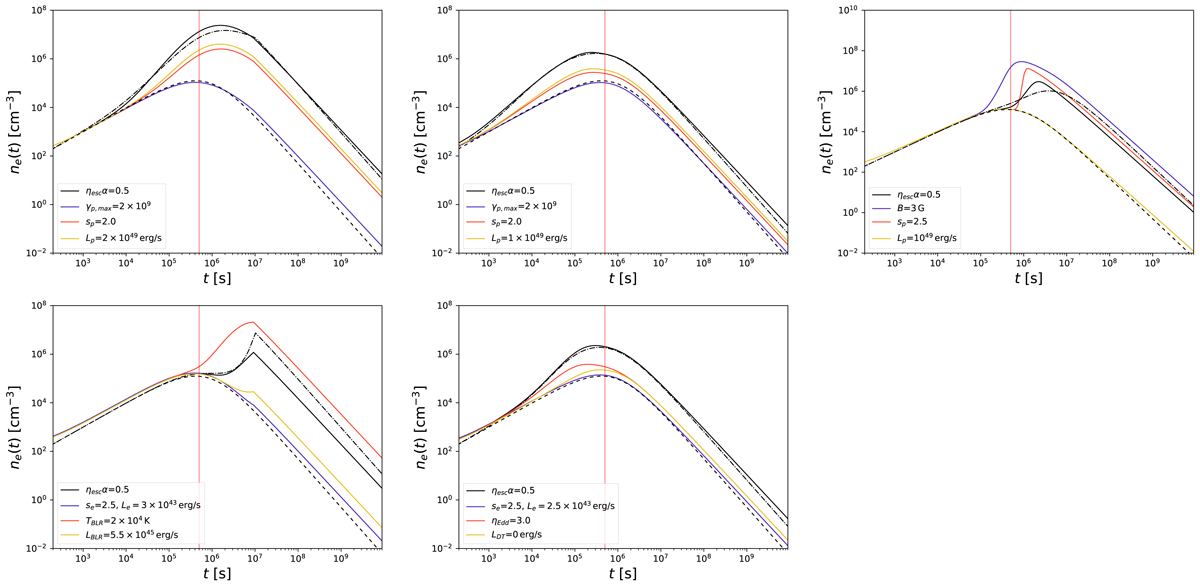
Small parameter study using OneHaLe. The black lines correspond in style to those in Figs. 2–6, but for the case ηescα = 0.5. The solid colored lines show simulations varying the input parameter as labeled. In the bottom panels, the variation in the electron parameters (magenta lines) preserves the initial injection rate of ∼1 cm−3 s−1.
Current usage metrics show cumulative count of Article Views (full-text article views including HTML views, PDF and ePub downloads, according to the available data) and Abstracts Views on Vision4Press platform.
Data correspond to usage on the plateform after 2015. The current usage metrics is available 48-96 hours after online publication and is updated daily on week days.
Initial download of the metrics may take a while.