Fig. 10.
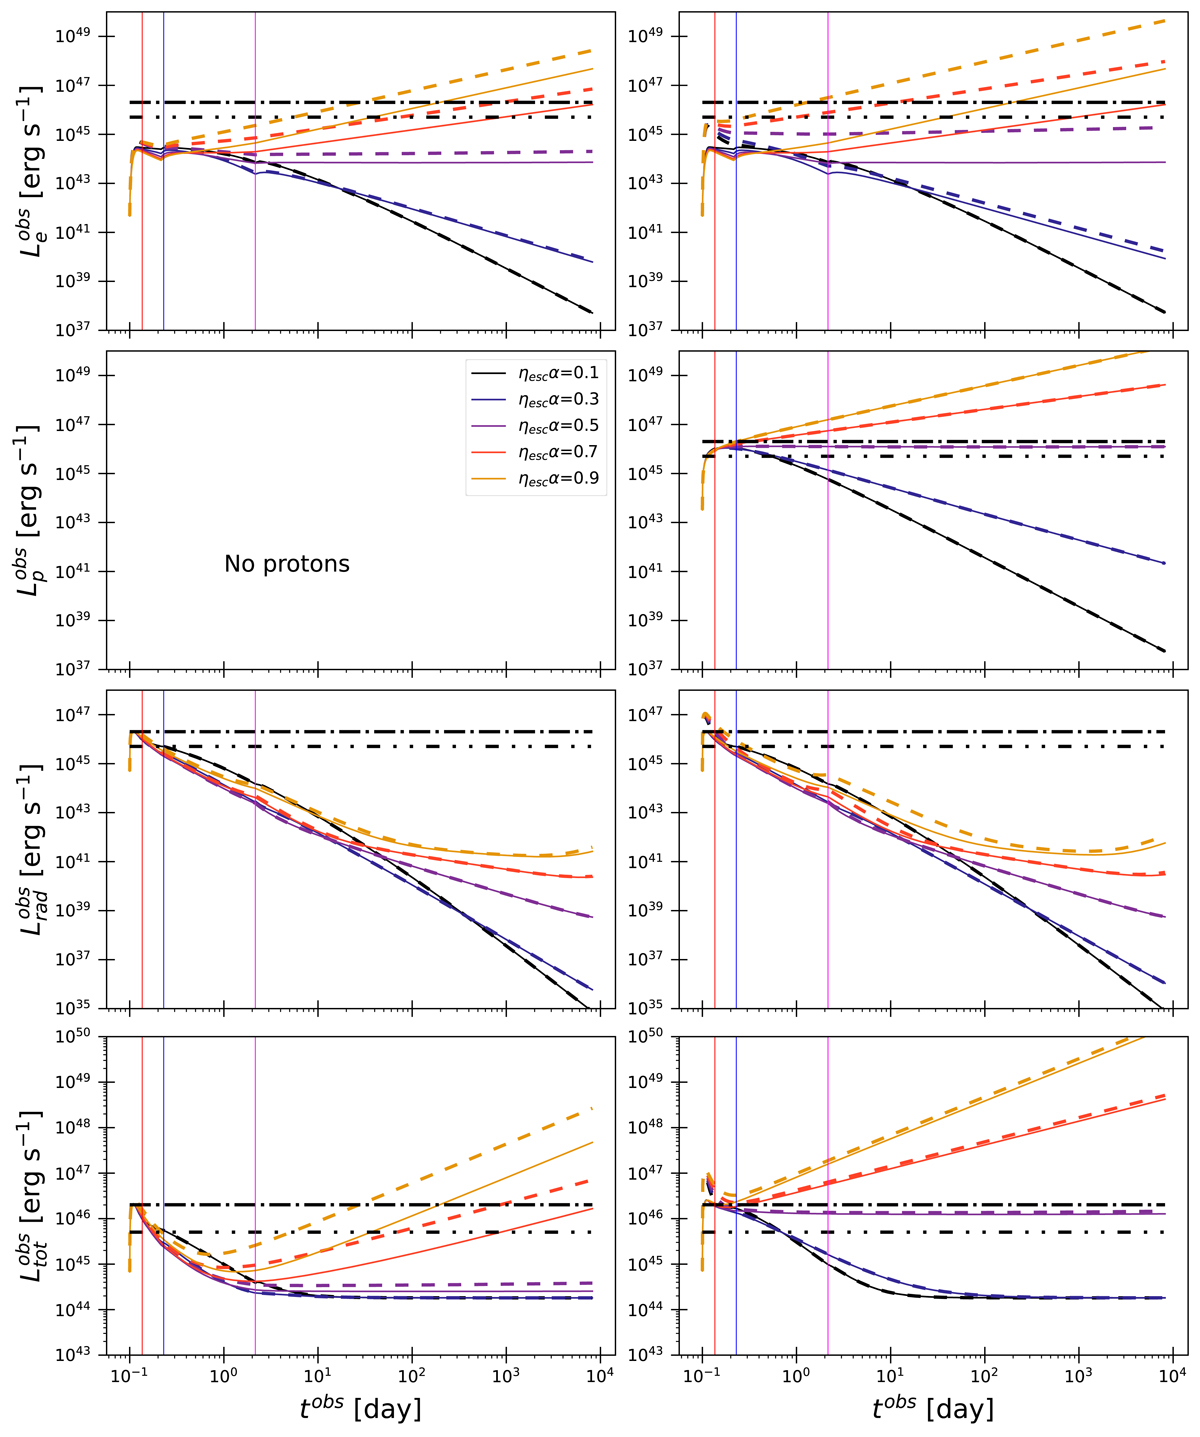
Download original image
Electron luminosity (top row), proton luminosity (second row), radiation luminosity (third row), and total luminosity (bottom row) as a function of time for pure electron (left column) and electron-proton simulations (right column) for different opening angles (color code as labeled) using the parameters of PKS 1510−089 as in Fig. 8. Simulations without pair production are marked by solid lines, while dashed lines refer to simulations with pair production. The vertical lines have the same meaning as in Fig. 8. The black dot-dashed and black dash-double-dotted lines mark the Eddington and AD luminosities, respectively. We note the logarithmic time axis.
Current usage metrics show cumulative count of Article Views (full-text article views including HTML views, PDF and ePub downloads, according to the available data) and Abstracts Views on Vision4Press platform.
Data correspond to usage on the plateform after 2015. The current usage metrics is available 48-96 hours after online publication and is updated daily on week days.
Initial download of the metrics may take a while.