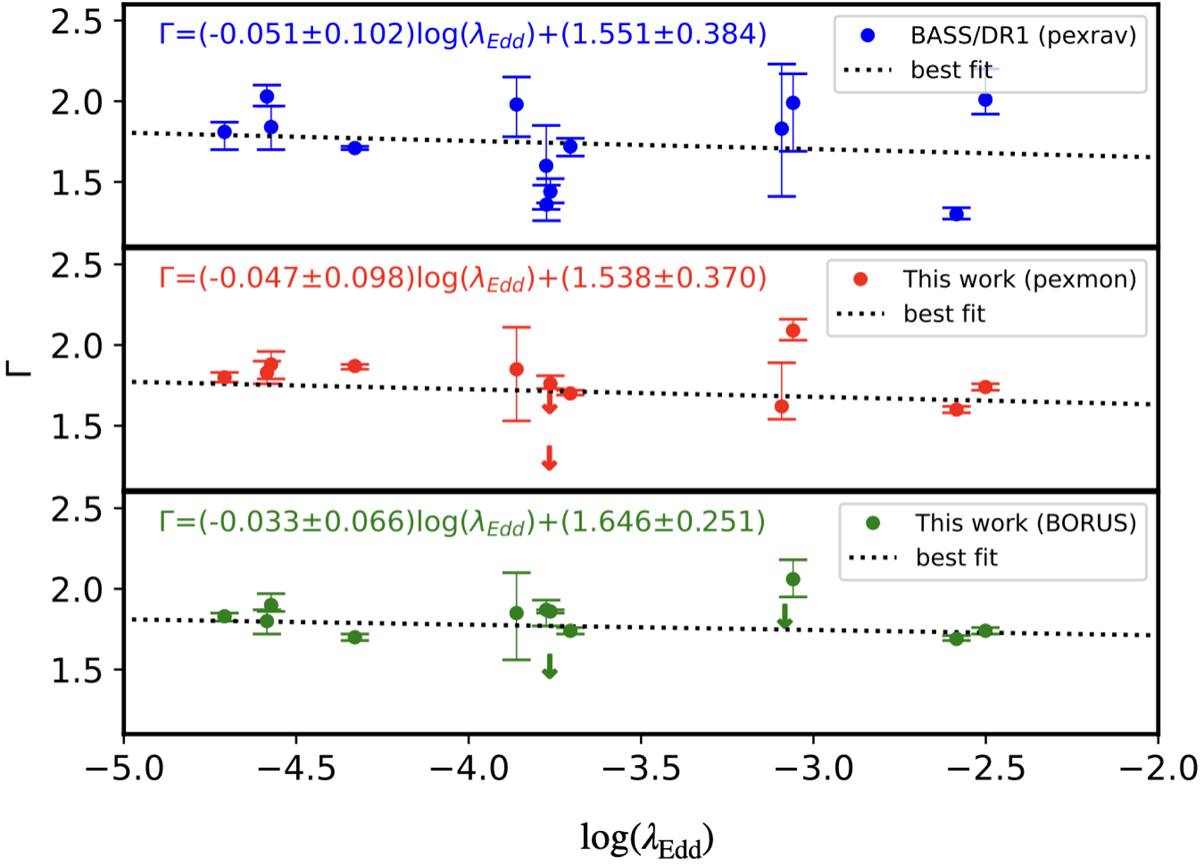
Fig. C.2.
Download original image
Relation between the spectral index, Γ, and the accretion rate, log(λEdd). The blue points (top panel) represent the values obtained by (Ricci et al. 2017a) using PEXRAV model from the DR1. The middle panel (red points) represents the data points obtained in this work using PEXMON reflection model. In the lower panel (green points) are the values obtained in this work using borus02 reflection model. The dotted black lines are the best fit in all the panels.
Current usage metrics show cumulative count of Article Views (full-text article views including HTML views, PDF and ePub downloads, according to the available data) and Abstracts Views on Vision4Press platform.
Data correspond to usage on the plateform after 2015. The current usage metrics is available 48-96 hours after online publication and is updated daily on week days.
Initial download of the metrics may take a while.