Fig. C.1.
Download original image
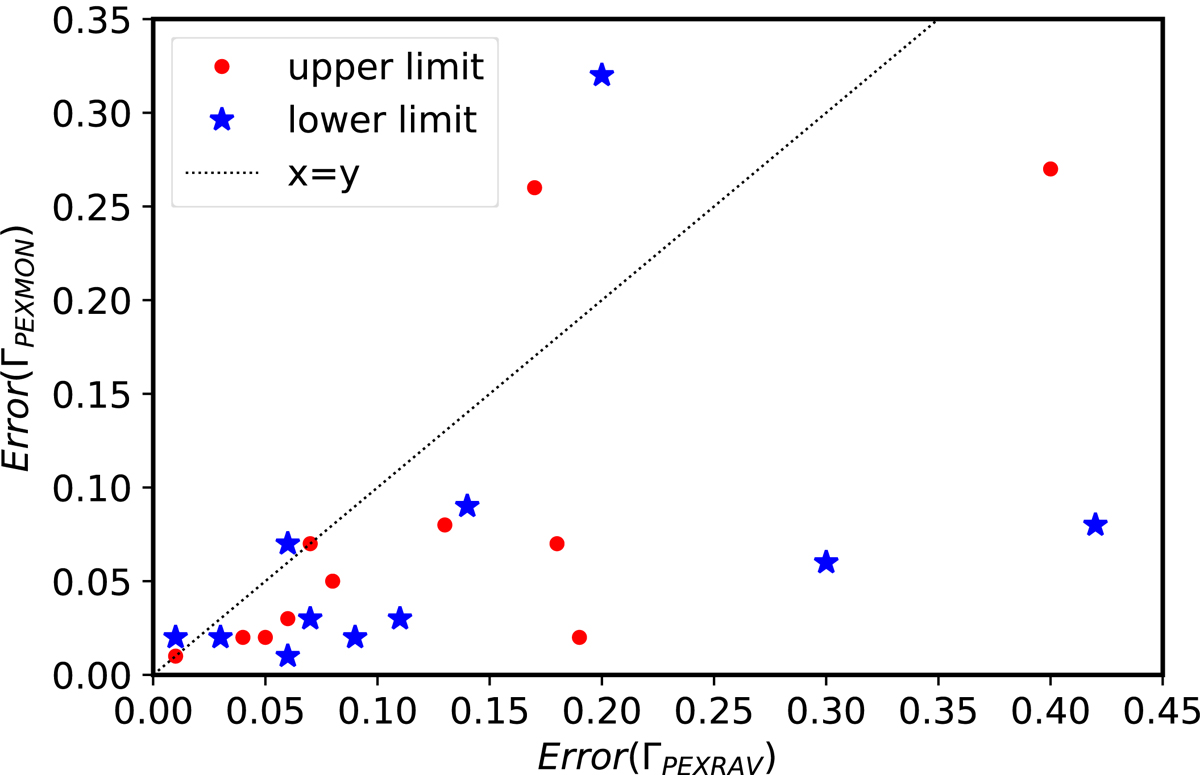
Relation between the error between our work using NuSTAR data and PEXMON model and the error values obtained using PEXRAV and observation from Swift/XRT, Swift/BAT, ASCA, Chandra, and Suzaku by Ricci et al. (2017a). The red circles represent the upper limit of the error bar and the blue stars the lower limit. The dotted black line is x=y.
Current usage metrics show cumulative count of Article Views (full-text article views including HTML views, PDF and ePub downloads, according to the available data) and Abstracts Views on Vision4Press platform.
Data correspond to usage on the plateform after 2015. The current usage metrics is available 48-96 hours after online publication and is updated daily on week days.
Initial download of the metrics may take a while.