Fig. 7.
Download original image
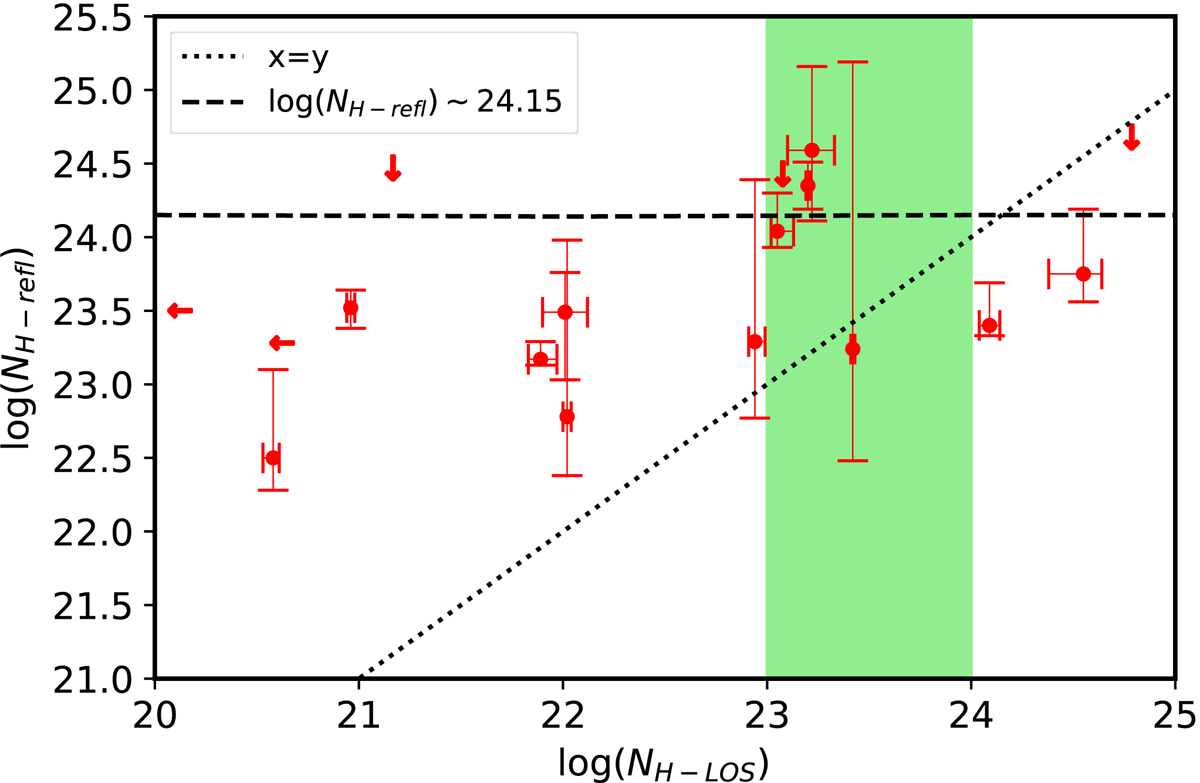
Relation between the column density of the torus-like reflector (in log) vs. column density in the LOS (in log). The red points represent the data point of this work. The black dashed line corresponds to the value obtained by Zhao et al. (2021) and the black dotted represents x = y. The green zone is the interval of the column density in the LOS analyzed in their work.
Current usage metrics show cumulative count of Article Views (full-text article views including HTML views, PDF and ePub downloads, according to the available data) and Abstracts Views on Vision4Press platform.
Data correspond to usage on the plateform after 2015. The current usage metrics is available 48-96 hours after online publication and is updated daily on week days.
Initial download of the metrics may take a while.