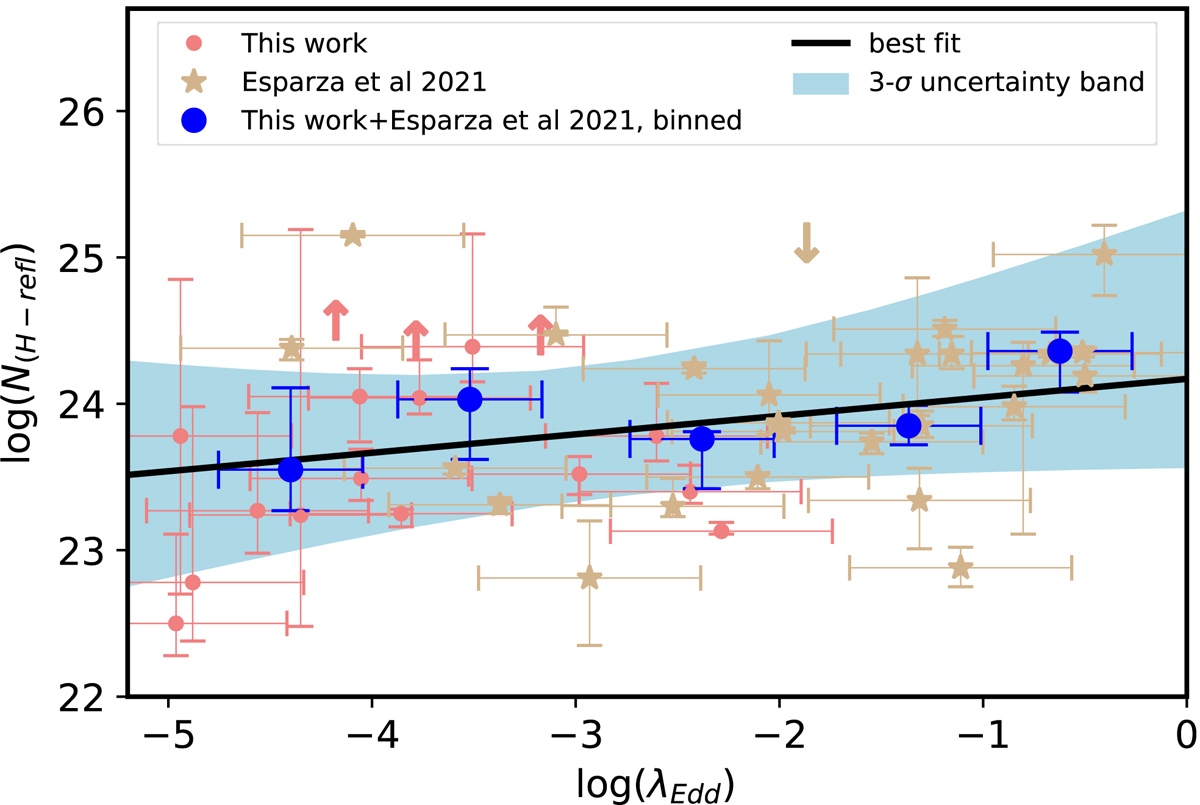
Fig. 6.
Download original image
Relation between the column density of the torus-like reflector (in log) vs. the Eddington ratio, λEdd = Lbol/LEdd, for the sample of this work. The pink points and light yellow stars are the data point of the best fit model of this work (borus02) and the one obtained by Esparza-Arredondo et al. (2021). The blue points represented the binned data point for a bin size equal to 0.5. The black solid line represents the best fit and the light blue zone the 3σ confidence level.
Current usage metrics show cumulative count of Article Views (full-text article views including HTML views, PDF and ePub downloads, according to the available data) and Abstracts Views on Vision4Press platform.
Data correspond to usage on the plateform after 2015. The current usage metrics is available 48-96 hours after online publication and is updated daily on week days.
Initial download of the metrics may take a while.