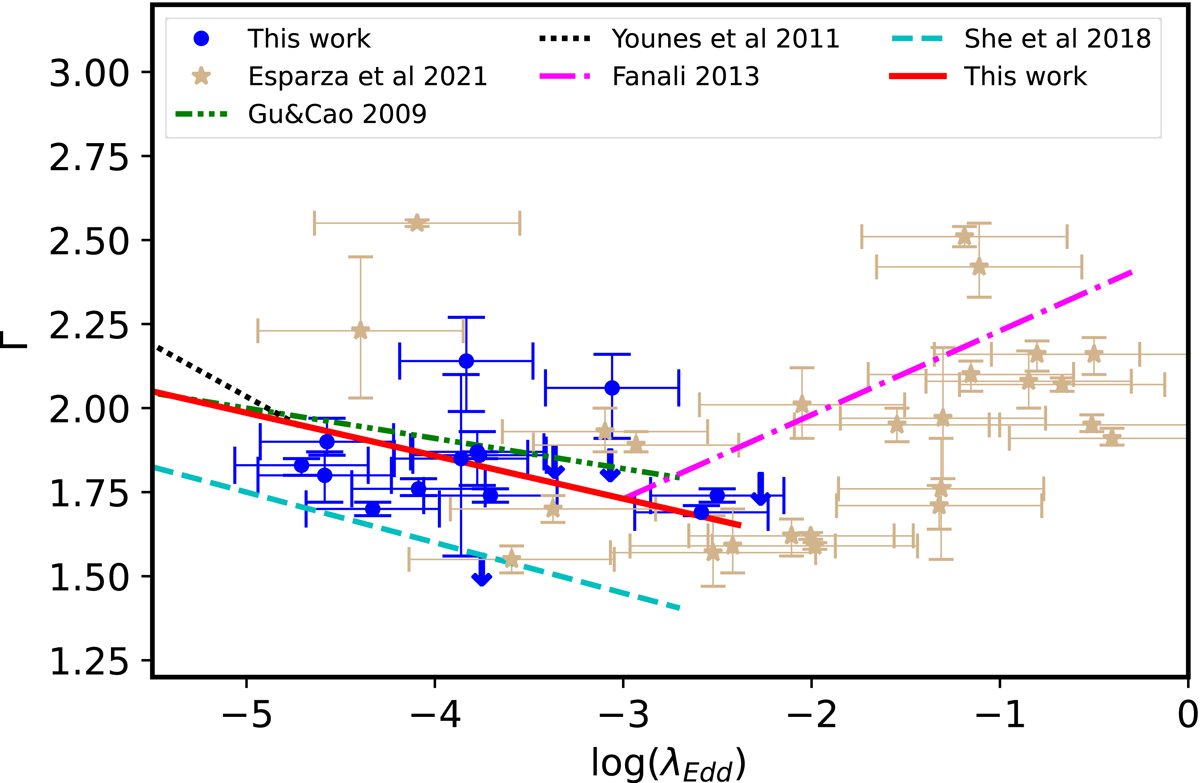
Fig. 5.
Download original image
Correlation between the spectral index, Γ, from individual fits, vs. the Eddington ratio, log(λEdd)=log(LBol/LEdd), for our sample of galaxies of the best fit models. The dotted and dashed green line represent the relation given by Gu & Cao (2009), the orange dotted represents Younes et al. (2011), the magenta dashed line is the relation obtained by She et al. (2018), while the solid black line is the correlation obtained in this work. The purple dashed line corresponds to the relation found by Fanali et al. (2013). The blue points represented the binned data. The pink points and light yellow stars are the data point of the best fit model in this work and the ones obtained by Esparza-Arredondo et al. (2021).
Current usage metrics show cumulative count of Article Views (full-text article views including HTML views, PDF and ePub downloads, according to the available data) and Abstracts Views on Vision4Press platform.
Data correspond to usage on the plateform after 2015. The current usage metrics is available 48-96 hours after online publication and is updated daily on week days.
Initial download of the metrics may take a while.