Fig. 1.
Download original image
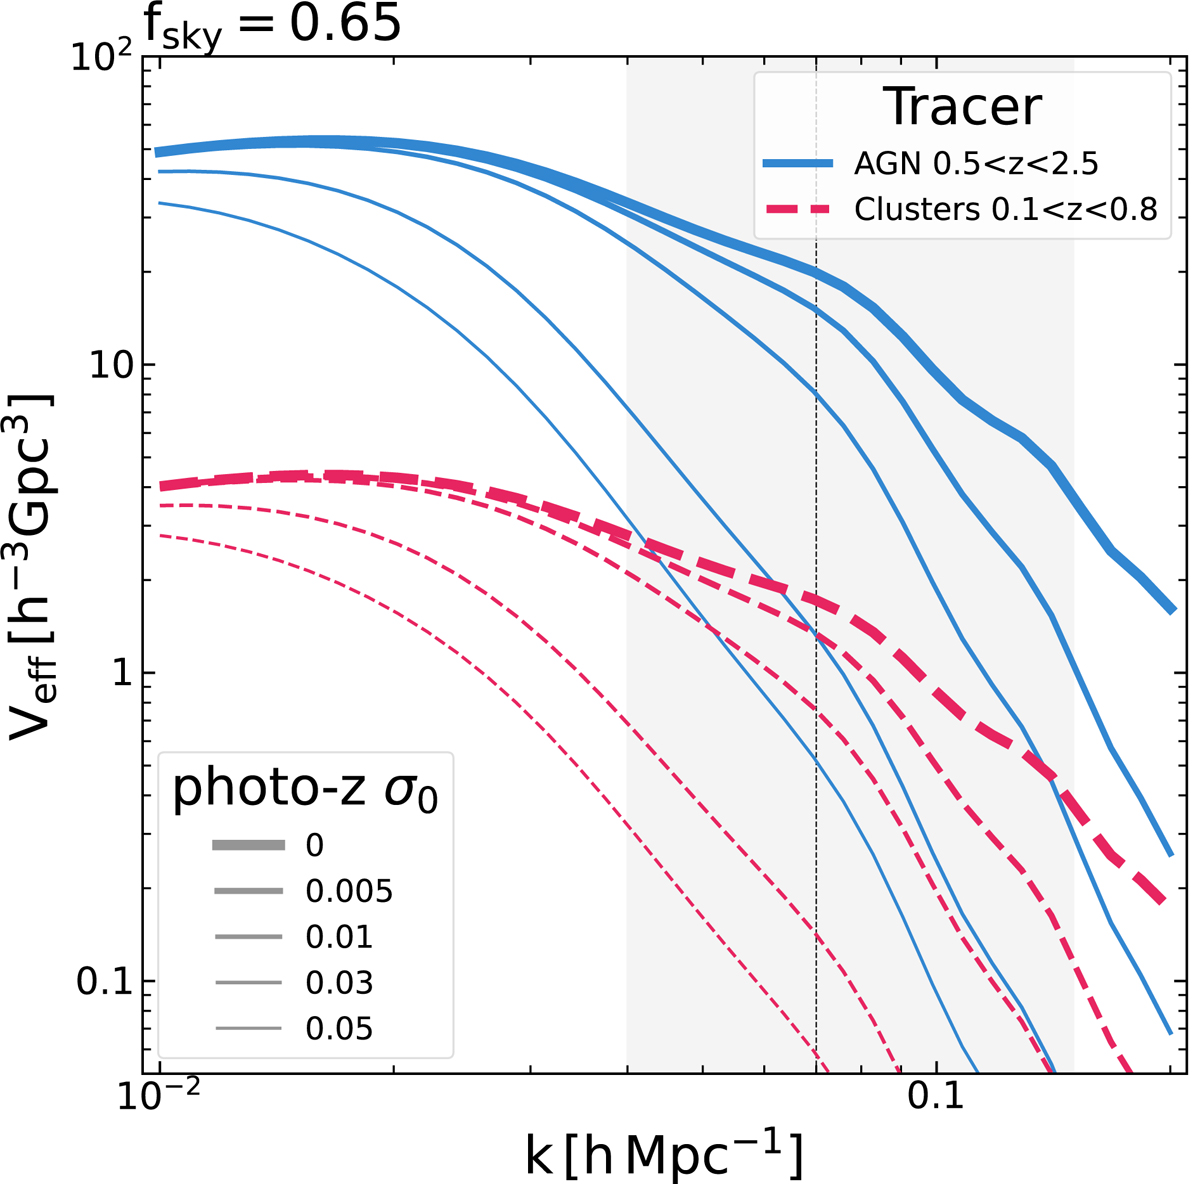
Effective volume as a function of co-moving scale probed by AGNs and clusters (solid and dashed lines, respectively) in the eROSITA all-sky survey. The thicker the line, the better the quality of photo z. The grey band illustrates the scales where the BAO feature is prominent, and the vertical dashed line shows the position of the first peak.
Current usage metrics show cumulative count of Article Views (full-text article views including HTML views, PDF and ePub downloads, according to the available data) and Abstracts Views on Vision4Press platform.
Data correspond to usage on the plateform after 2015. The current usage metrics is available 48-96 hours after online publication and is updated daily on week days.
Initial download of the metrics may take a while.