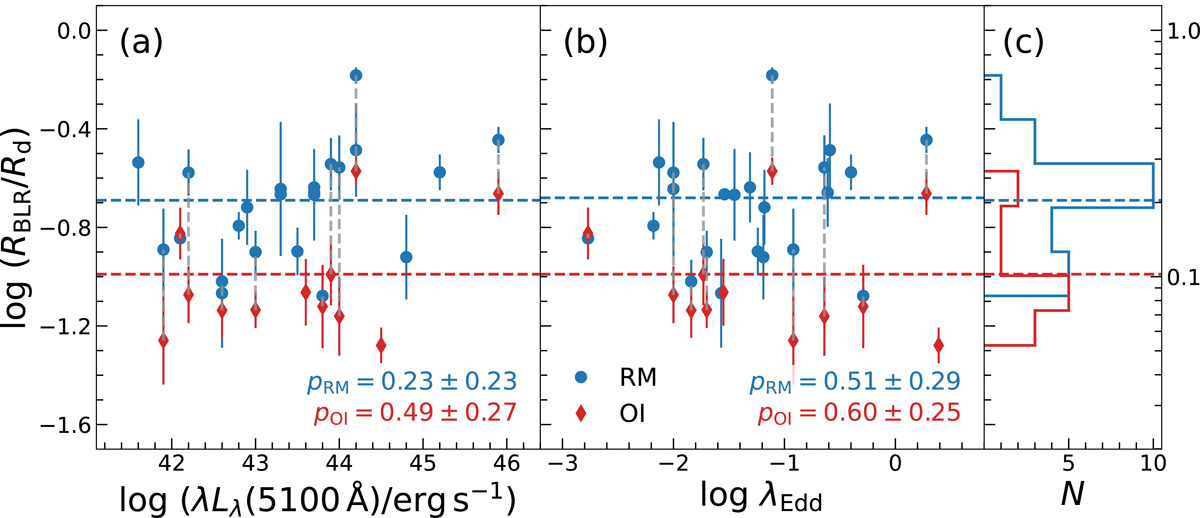
Fig. 3.
Download original image
Ratio of BLR and dust continuum sizes as a function of (a) the AGN luminosity and (b) the Eddington ratio. The p-values of Spearman’s rank correlation coefficient are reported in the lower right corner of each panel for RM- and OI-measured samples. The notations are the same as in Fig. 2. The error bars are the quadrature sum of the uncertainties of RBLR and Rd. Panel c displays the histograms of the ratios. The dashed lines indicate the averaged RBLR/Rd based on the fitting of the RBLR–Rd relations with β fixed to unity (see also Eq. (4)). RBLR/Rd does not show a statistically significant correlation with the λLλ(5100 Å) or the Eddington ratio. The linear scale of RBLR/Rd is indicated on the right.
Current usage metrics show cumulative count of Article Views (full-text article views including HTML views, PDF and ePub downloads, according to the available data) and Abstracts Views on Vision4Press platform.
Data correspond to usage on the plateform after 2015. The current usage metrics is available 48-96 hours after online publication and is updated daily on week days.
Initial download of the metrics may take a while.