Fig. 2.
Download original image
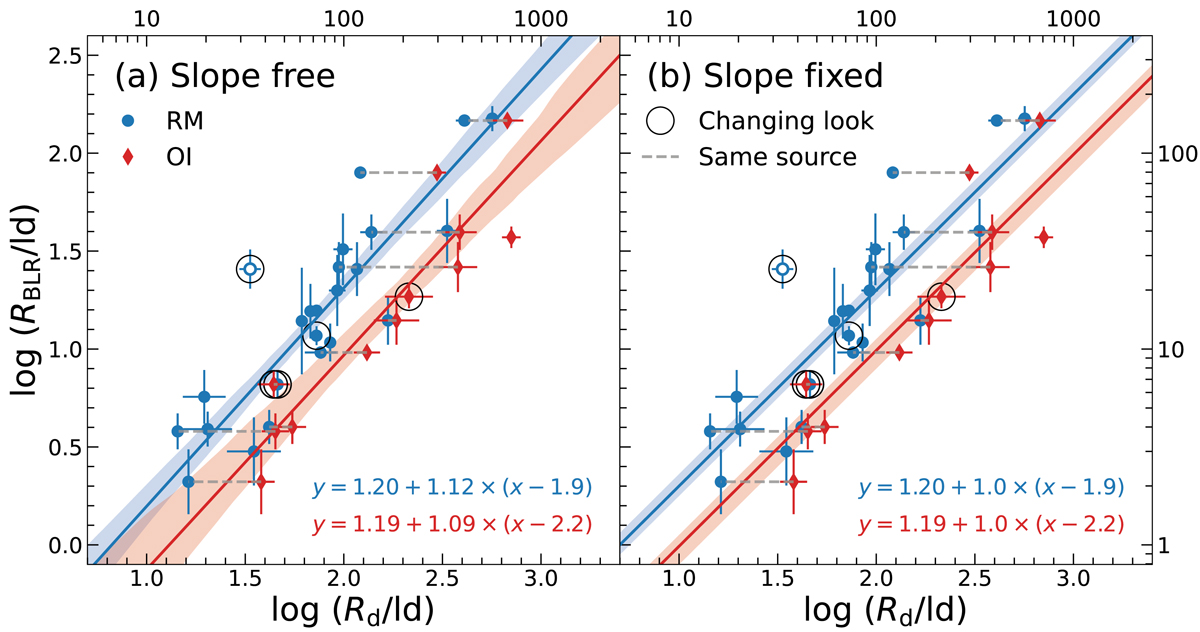
Tight relations between the radii of the BLR and the dust continuum. The blue circles are AGNs measured by RM, and the red diamonds are the targets measured by OI. The dashed gray lines connect the same sources with both RM and OI measured Rd. The best-fit RBLR–Rd relations of RM and OI datasets (formula in the lower right corner of each panel) are shown as the blue and red lines, respectively. The black circles enclose the known changing-look AGNs. We only exclude Mrk 590, denoted as the empty blue circle, from our analysis. The linear scale is indicated on the top and right axes.
Current usage metrics show cumulative count of Article Views (full-text article views including HTML views, PDF and ePub downloads, according to the available data) and Abstracts Views on Vision4Press platform.
Data correspond to usage on the plateform after 2015. The current usage metrics is available 48-96 hours after online publication and is updated daily on week days.
Initial download of the metrics may take a while.