Open Access
Fig. 5
Download original image
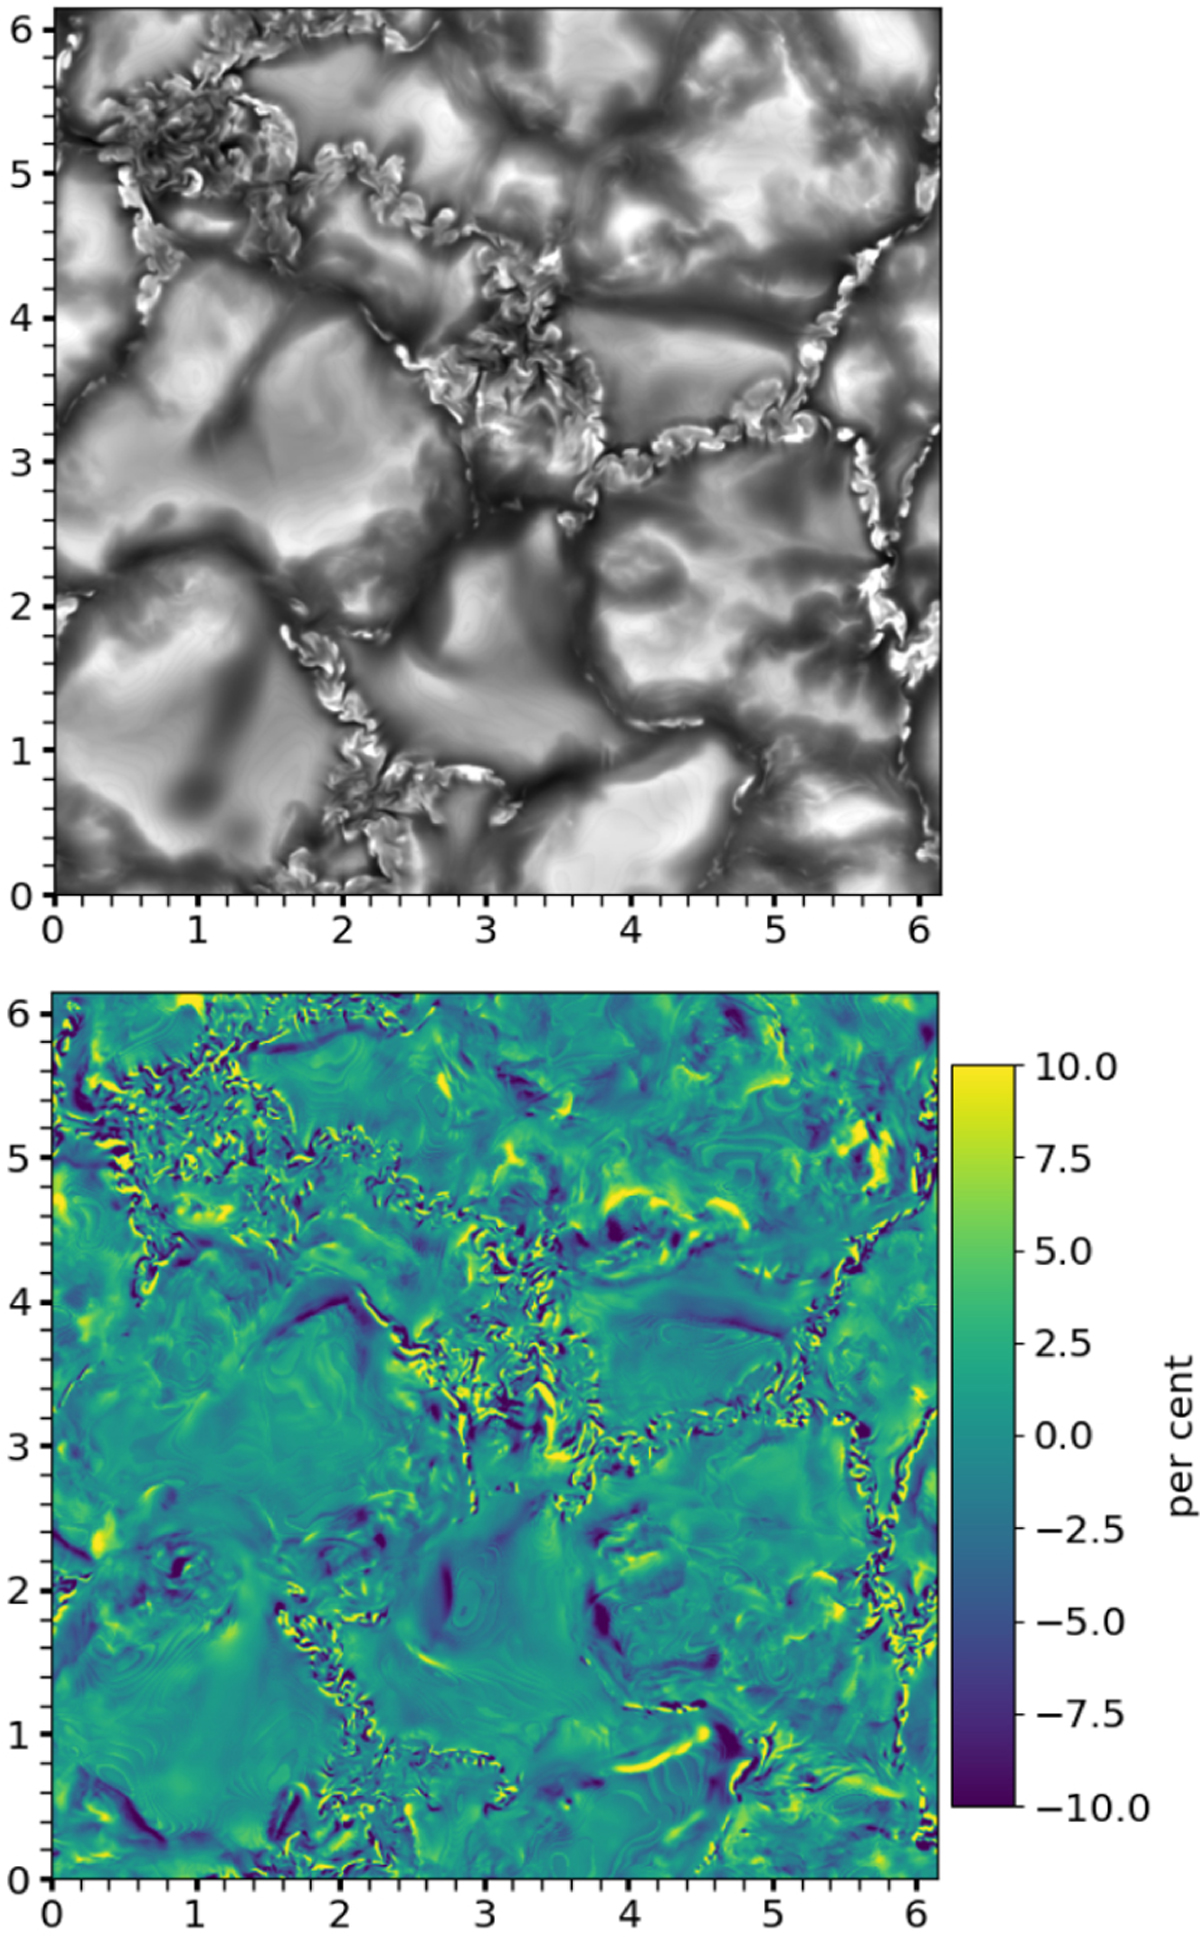
Change of continuum intensity during line scan. Upper panel: continuum image with intensities between 0.6 and 1.45 for the first snapshot. The average intensity is normalised to one. Lower panel: difference between the continuum images of snapshot 1 and snapshot 11. The difference map is clipped at differences of ±10%.
Current usage metrics show cumulative count of Article Views (full-text article views including HTML views, PDF and ePub downloads, according to the available data) and Abstracts Views on Vision4Press platform.
Data correspond to usage on the plateform after 2015. The current usage metrics is available 48-96 hours after online publication and is updated daily on week days.
Initial download of the metrics may take a while.