Fig. 11
Download original image
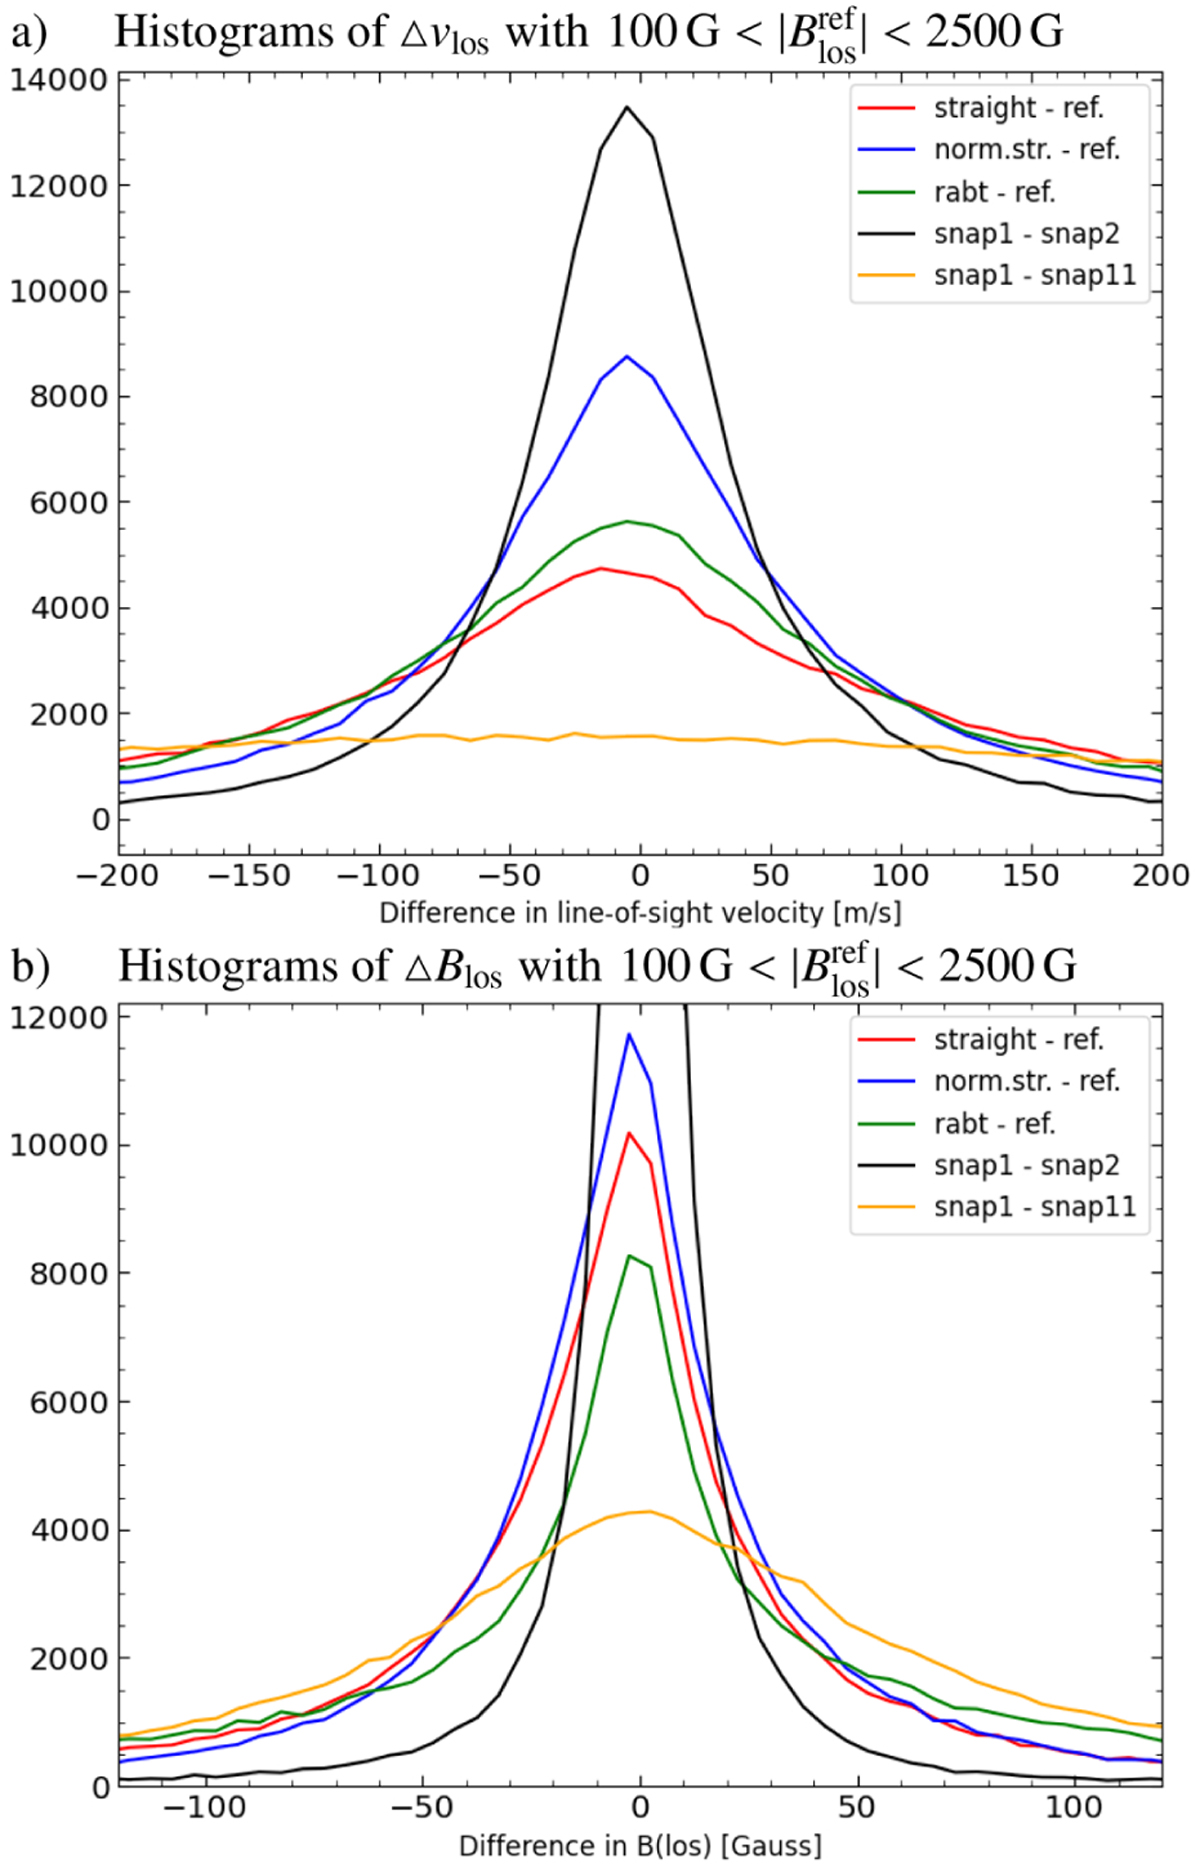
Histograms of difference maps for line-of-sight velocity, ∆vlos, in upper panel a and the vertical component of the magnetic field strength, ∆Blos, in lower panel b. The histograms include pixels that have ![]() . This corresponds to 25% of all pixels. The differences are taken for different cases: Red line → straight VTF and reference map; blue line → normalised straight VTF and reference map; green line → rabbit VTF and reference map; black line → snap 1 and snap 2; yellow line → snap 1 and snap 11.
. This corresponds to 25% of all pixels. The differences are taken for different cases: Red line → straight VTF and reference map; blue line → normalised straight VTF and reference map; green line → rabbit VTF and reference map; black line → snap 1 and snap 2; yellow line → snap 1 and snap 11.
Current usage metrics show cumulative count of Article Views (full-text article views including HTML views, PDF and ePub downloads, according to the available data) and Abstracts Views on Vision4Press platform.
Data correspond to usage on the plateform after 2015. The current usage metrics is available 48-96 hours after online publication and is updated daily on week days.
Initial download of the metrics may take a while.