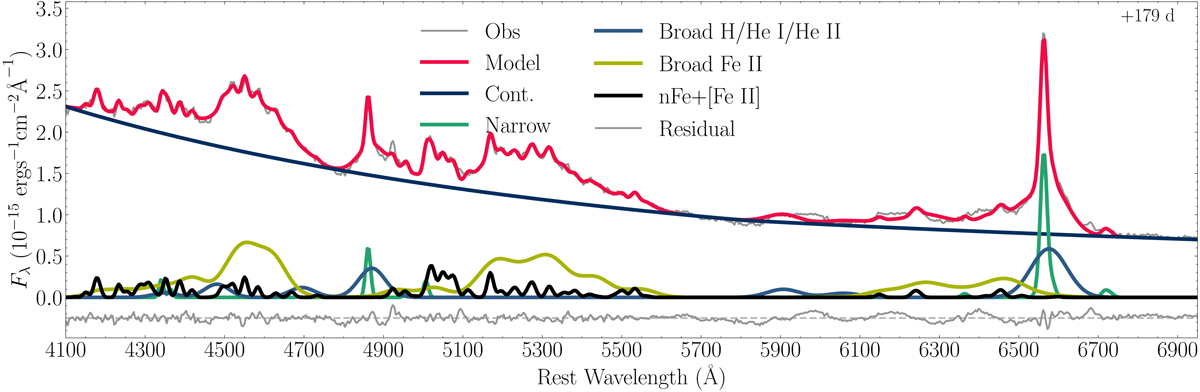
Fig. 8.
Download original image
Examples of multicomponent spectral fitting in the 4100 − 7000 Å rest-frame range for the +179 days spectrum (solid gray line). The underlying continuum emission and all emission-line components are plotted with different colors, as indicated in the legend. For details on the assumed emission-line components see text. The final model (solid red line) which is the sum of all components is also shown, whereas the residual spectrum, is plotted below.
Current usage metrics show cumulative count of Article Views (full-text article views including HTML views, PDF and ePub downloads, according to the available data) and Abstracts Views on Vision4Press platform.
Data correspond to usage on the plateform after 2015. The current usage metrics is available 48-96 hours after online publication and is updated daily on week days.
Initial download of the metrics may take a while.