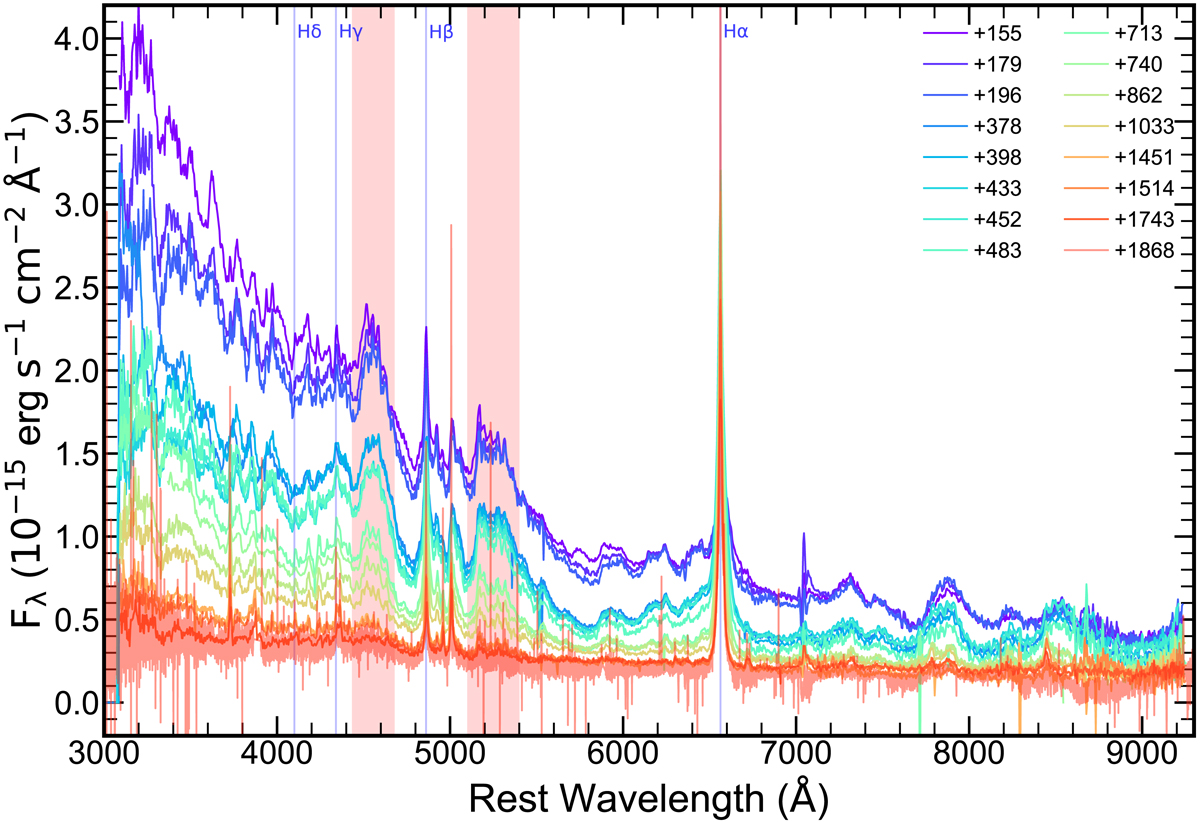
Fig. 3.
Download original image
Temporal evolution of the spectra taken with NTT/EFOSC2 (and the final X-shooter spectrum at +1868 days). The spectra are dominated by the Balmer series and a plethora of Fe II lines. The spectra are colored as indicated in the legend and the phases refer to rest-frame days after MJD 57577. Vertical solid lines indicate the position of hydrogen Balmer lines whereas the shaded pink areas mark the location of the strongest Fe II templates.
Current usage metrics show cumulative count of Article Views (full-text article views including HTML views, PDF and ePub downloads, according to the available data) and Abstracts Views on Vision4Press platform.
Data correspond to usage on the plateform after 2015. The current usage metrics is available 48-96 hours after online publication and is updated daily on week days.
Initial download of the metrics may take a while.