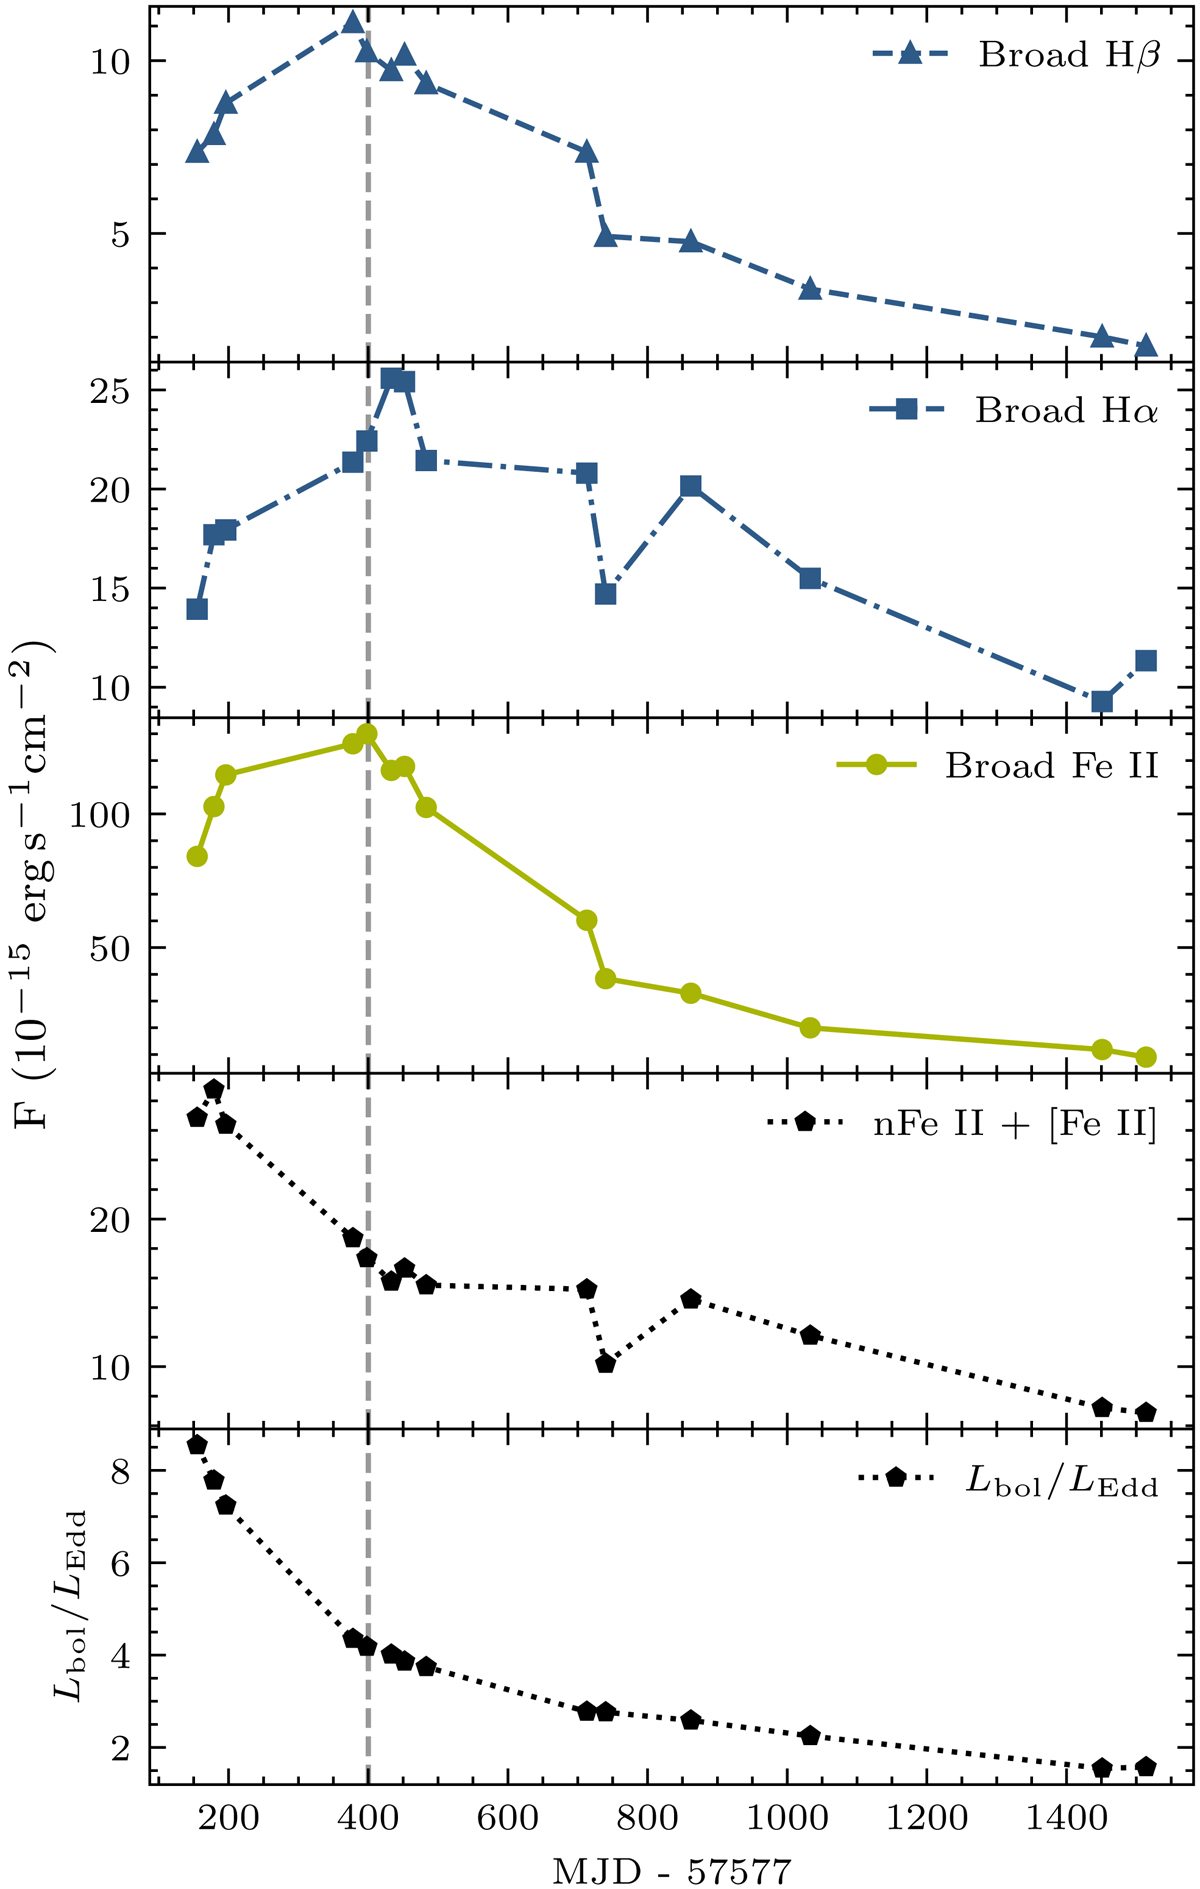
Fig. 10.
Download original image
Temporal evolution of the extracted emission lines and line-blends during the campaign. The bottom panel shows the evolution of Lbol/LEdd ratio, in which the bolometric luminosity is estimated from the spectral continuum at 5100 Å. The vertical dashed line indicates +400 days after the estimated outburst time to guide the eye.
Current usage metrics show cumulative count of Article Views (full-text article views including HTML views, PDF and ePub downloads, according to the available data) and Abstracts Views on Vision4Press platform.
Data correspond to usage on the plateform after 2015. The current usage metrics is available 48-96 hours after online publication and is updated daily on week days.
Initial download of the metrics may take a while.