Open Access
Fig. 4.
Download original image
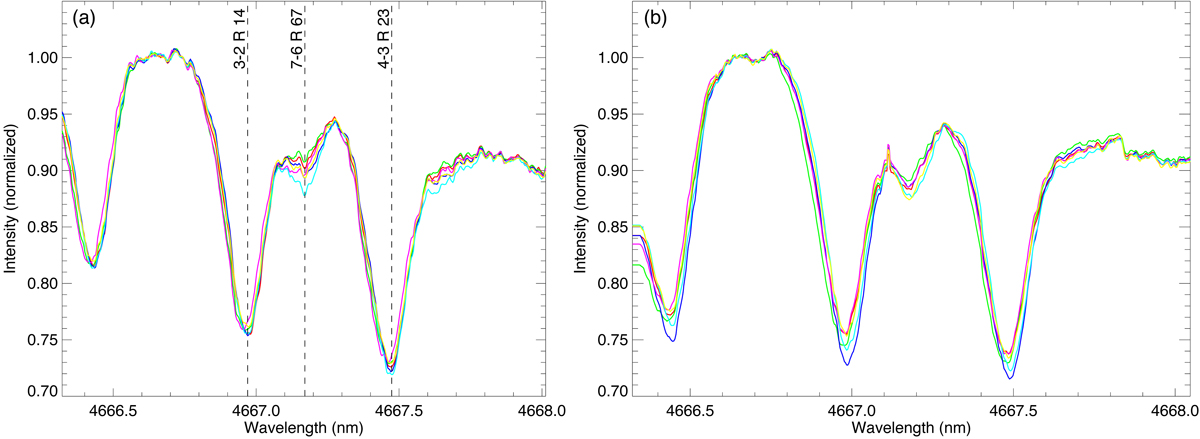
Normalized (I/Icontinuum) CO spectral lines in cold bubbles indicated by colored dots in Figs. 3a,d. The left panel (a) and right panel (b) are for September 8 and 11, 2018, respectively. The dashed lines in panel a indicate three typical CO lines around 4.66 μm.
Current usage metrics show cumulative count of Article Views (full-text article views including HTML views, PDF and ePub downloads, according to the available data) and Abstracts Views on Vision4Press platform.
Data correspond to usage on the plateform after 2015. The current usage metrics is available 48-96 hours after online publication and is updated daily on week days.
Initial download of the metrics may take a while.