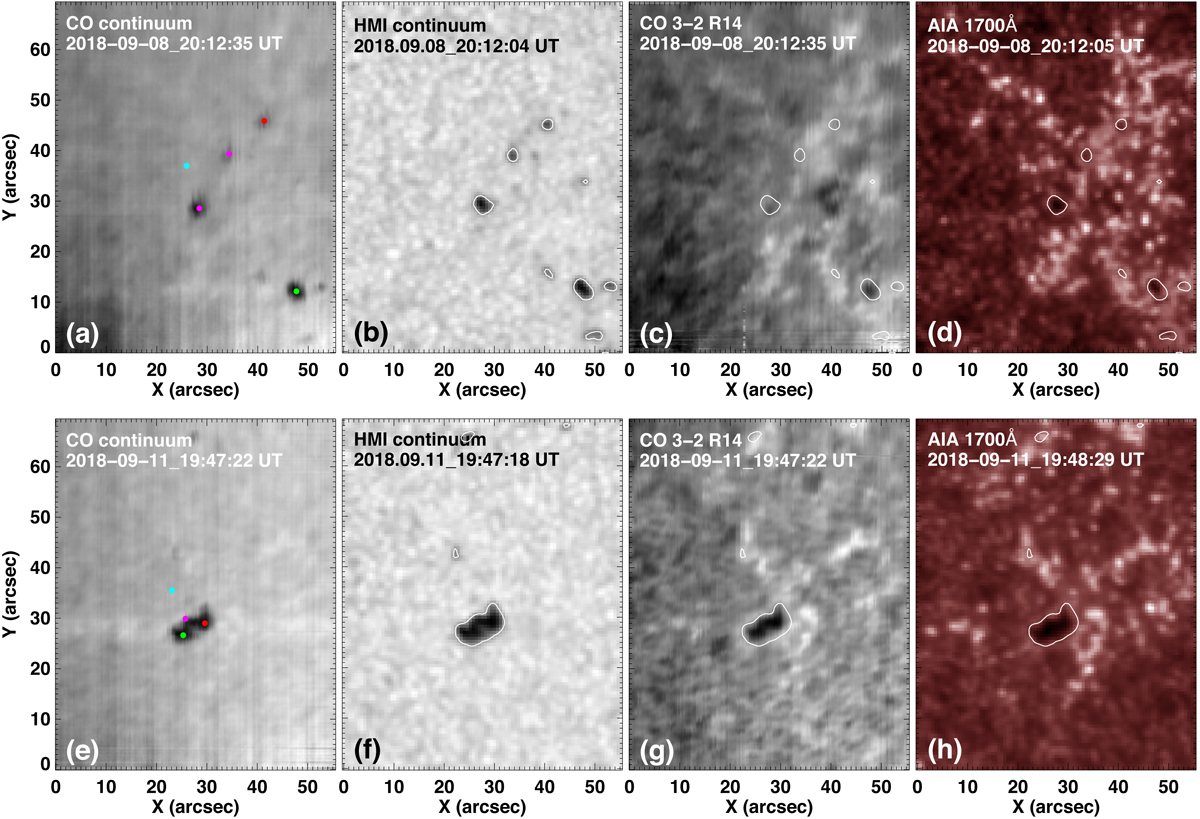
Fig. 1.
Download original image
Overview of pores observed at CO 4.6 μm continuum, HMI continuum, CO 3–2 R14 line center, and AIA 1700 Å. The upper (a–d) and lower (e–h) panels were observed on September 8 and 11, 2018, respectively. The white contours indicate the enhanced absorption features (pores) in HMI continuum intensity images. The colored dots in panels a and e give the positions of the CO spectral lines shown in Figs. 2a,b.
Current usage metrics show cumulative count of Article Views (full-text article views including HTML views, PDF and ePub downloads, according to the available data) and Abstracts Views on Vision4Press platform.
Data correspond to usage on the plateform after 2015. The current usage metrics is available 48-96 hours after online publication and is updated daily on week days.
Initial download of the metrics may take a while.