Open Access
Fig. 9
Download original image
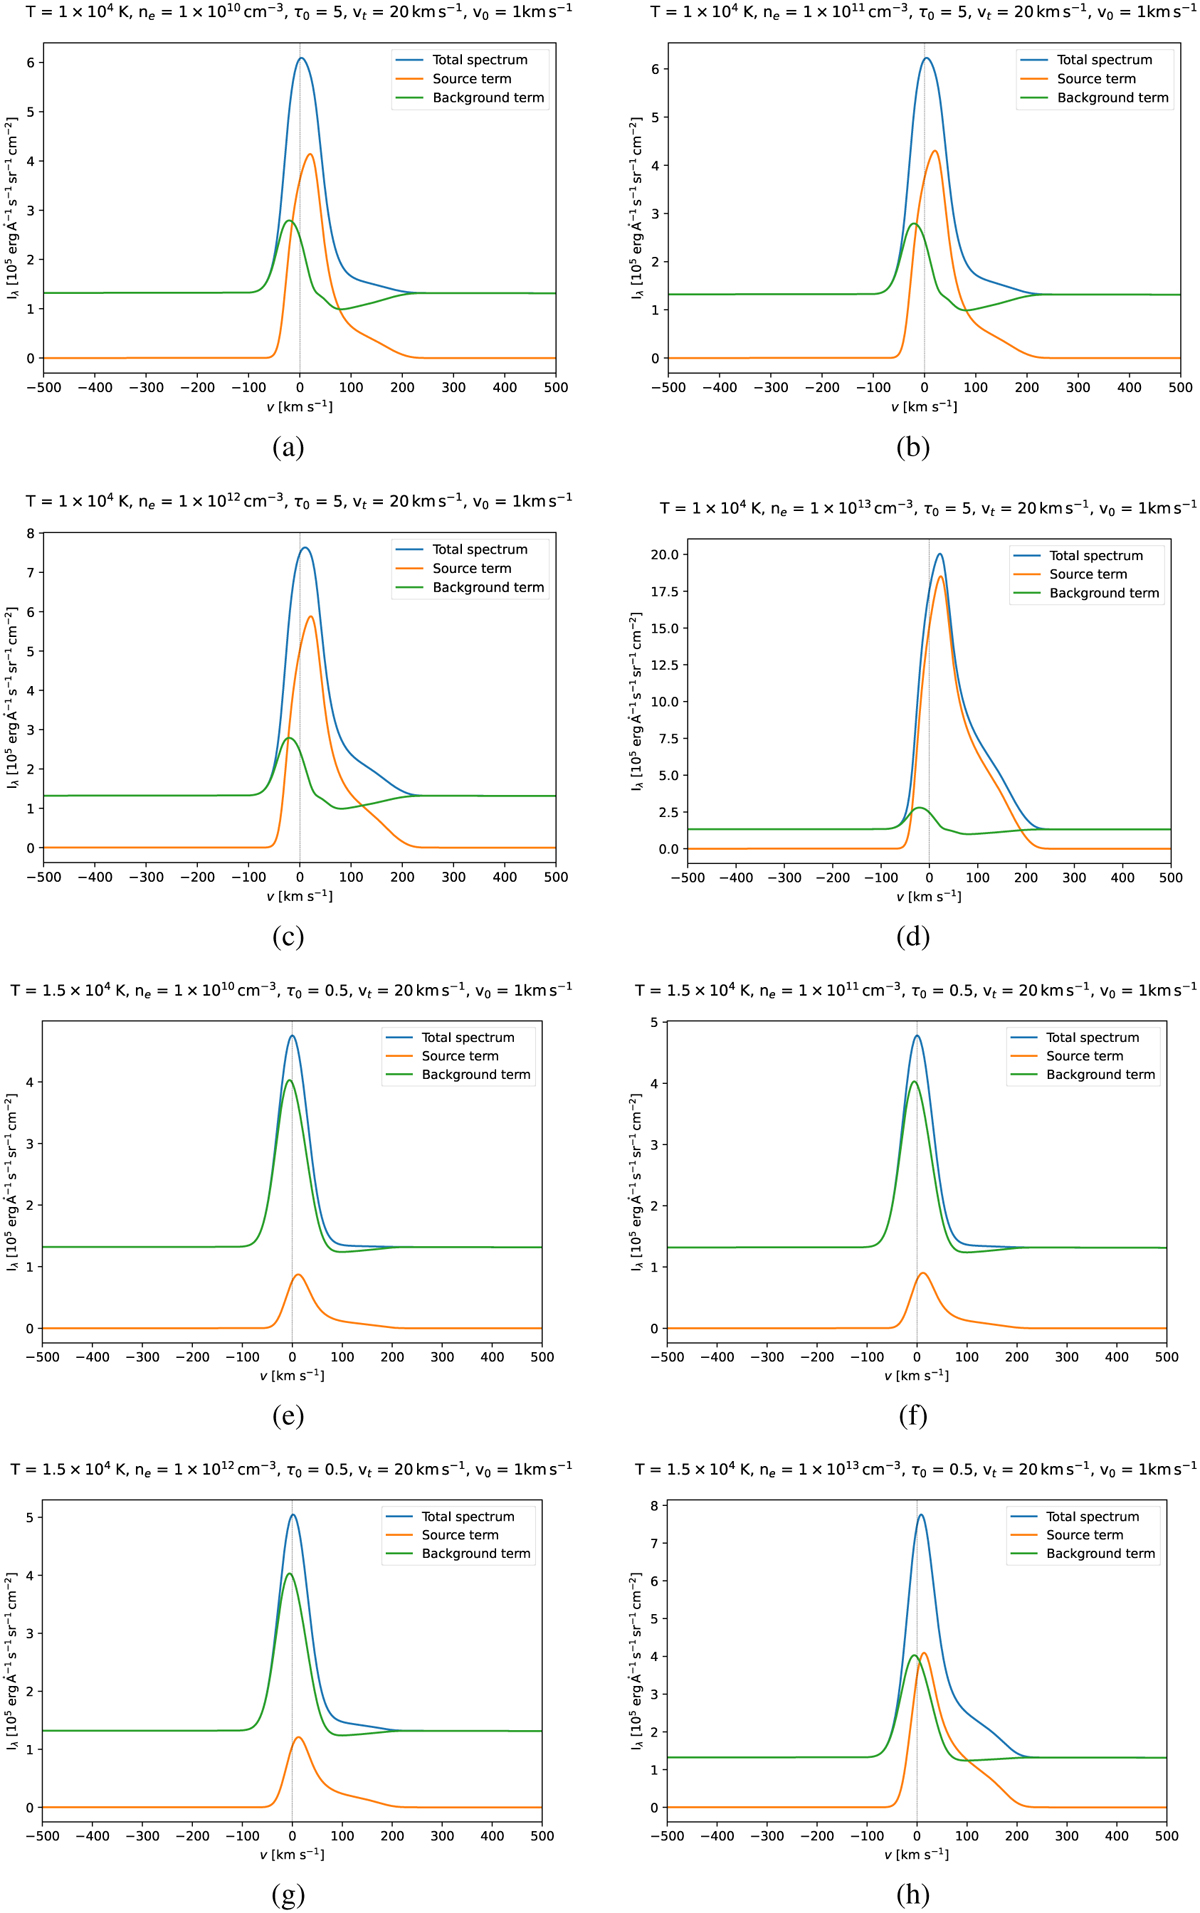
Synthetic Hα line profiles. The modeled specific intensity is the sum of the attenuated background radiation and the source radiation. The components are plotted as well as the sum. This figure shows variations in the modeled profiles with electron density for two values of the temperature and optical thickness.
Current usage metrics show cumulative count of Article Views (full-text article views including HTML views, PDF and ePub downloads, according to the available data) and Abstracts Views on Vision4Press platform.
Data correspond to usage on the plateform after 2015. The current usage metrics is available 48-96 hours after online publication and is updated daily on week days.
Initial download of the metrics may take a while.