Fig. 12
Download original image
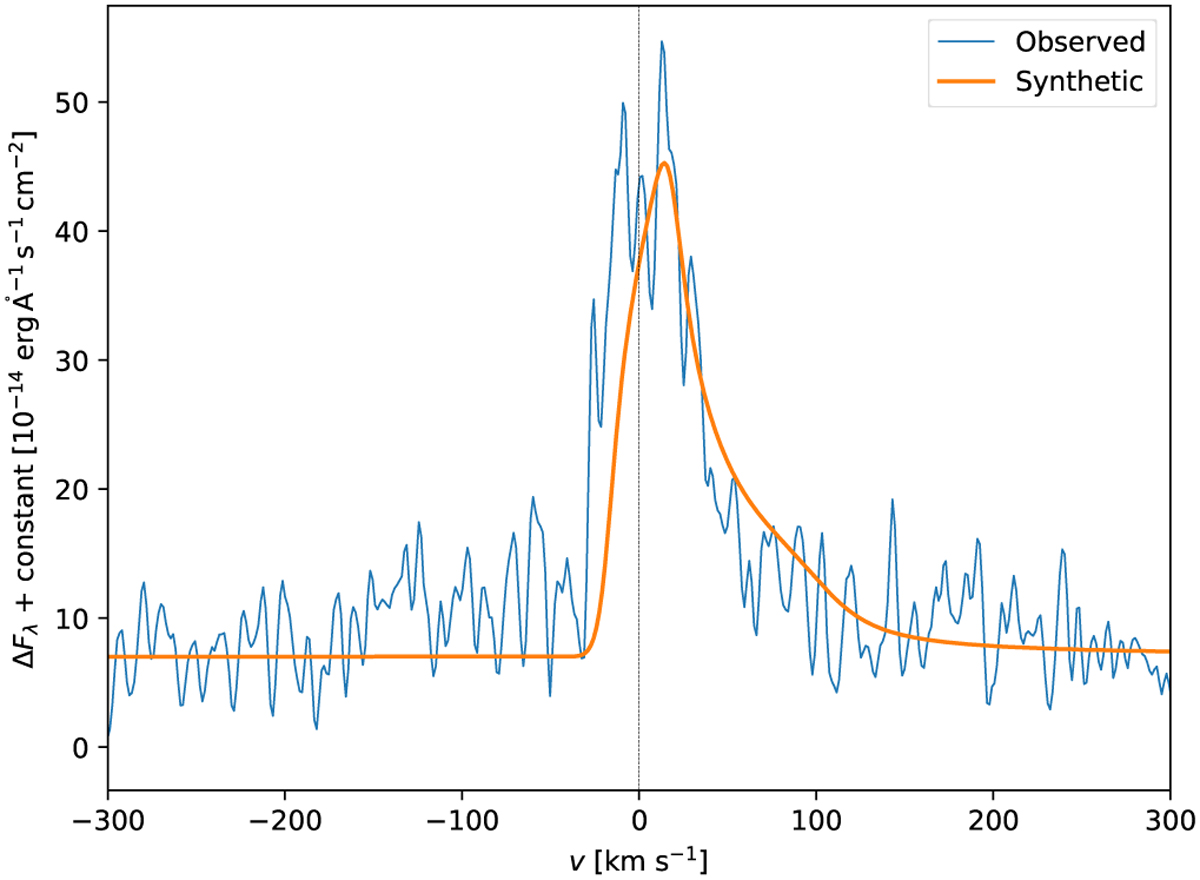
Fit of the modeled spectrum difference ΔFλ and the spectrum difference ΔFλ observed on 18 April 2019 during the gradual phase at 22:07 UT in Fig. 1. To account for the observed continuum enhancements, a constant is added to the synthetic profile difference as a fit parameter. The synthetic profile has a similar shape as the observed profile within the range of 15–50 km s¯1.
Current usage metrics show cumulative count of Article Views (full-text article views including HTML views, PDF and ePub downloads, according to the available data) and Abstracts Views on Vision4Press platform.
Data correspond to usage on the plateform after 2015. The current usage metrics is available 48-96 hours after online publication and is updated daily on week days.
Initial download of the metrics may take a while.