Fig. 7.
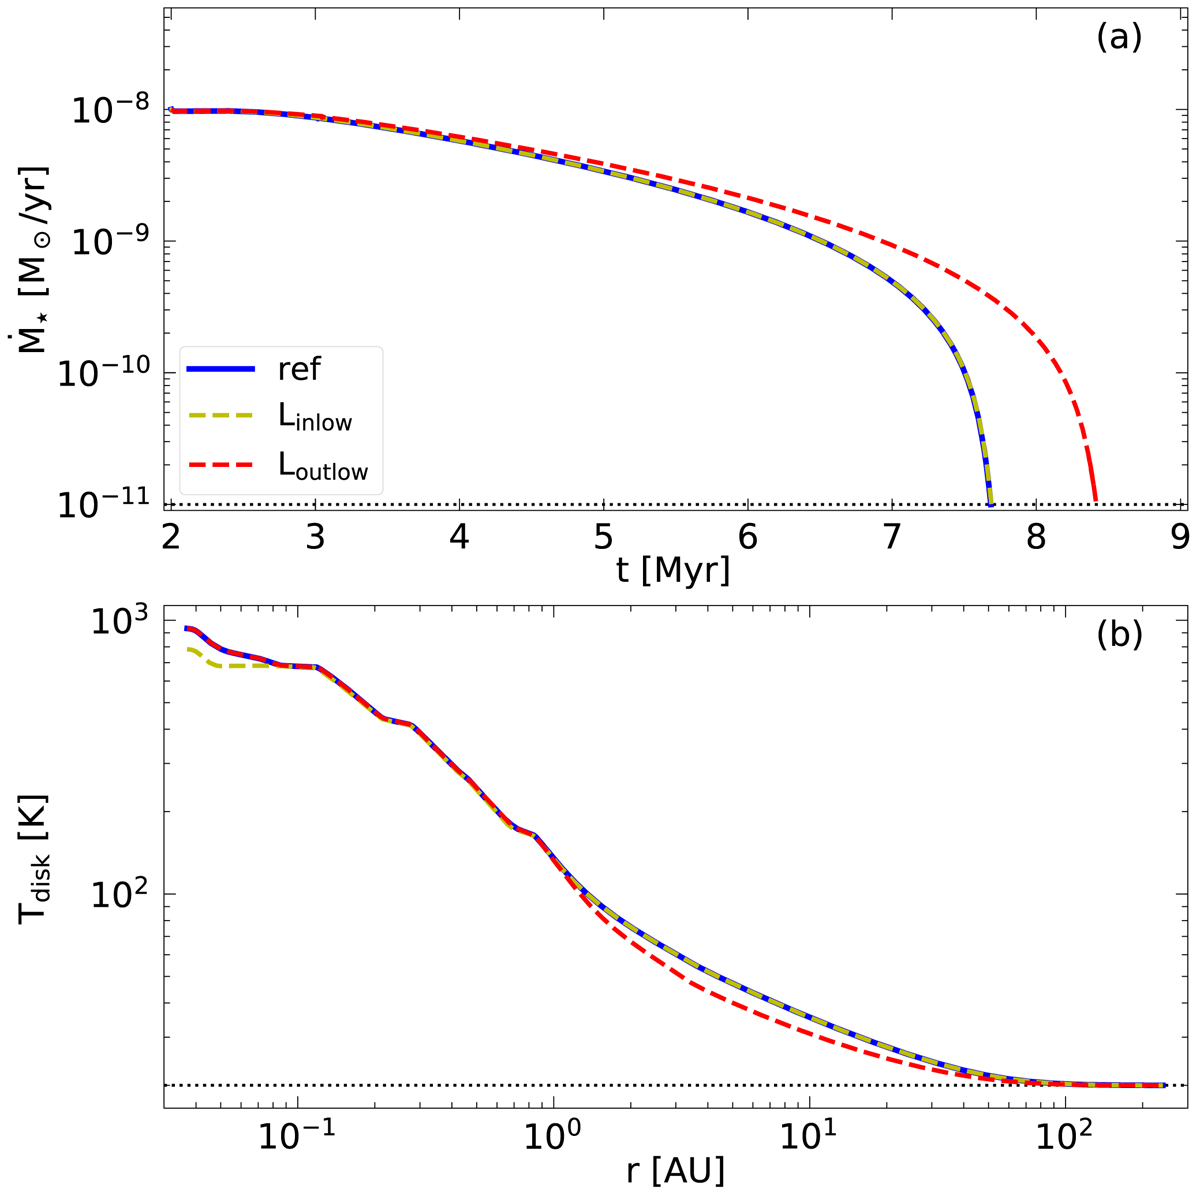
Download original image
Comparison between models Linlow (yellow line) and Loutlow (red line). The reference model (ref, blue line) corresponds to a Z = 1 Z⊙ star with Ṁstart = 1 × 10⁻⁸ M⊙ yr−1. The stellar luminosity is artificially reduced by 25% in the inner 1 AU (Linlow) and outside 1 AU (Loutlow). Panel a shows the evolution of the accretion rate. The dotted black line shows the termination criterion used in our simulations of Ṁ = 10−11 M⊙ yr−1. Panel b shows the temperature structure of the initial disk model. For model Linlow the inner disk region is cooler compared to the reference model, and for model Loutlow the outer disk region is cooler. The dotted black line shows the ambient temperature of 20 K.
Current usage metrics show cumulative count of Article Views (full-text article views including HTML views, PDF and ePub downloads, according to the available data) and Abstracts Views on Vision4Press platform.
Data correspond to usage on the plateform after 2015. The current usage metrics is available 48-96 hours after online publication and is updated daily on week days.
Initial download of the metrics may take a while.