Fig. 5.
Download original image
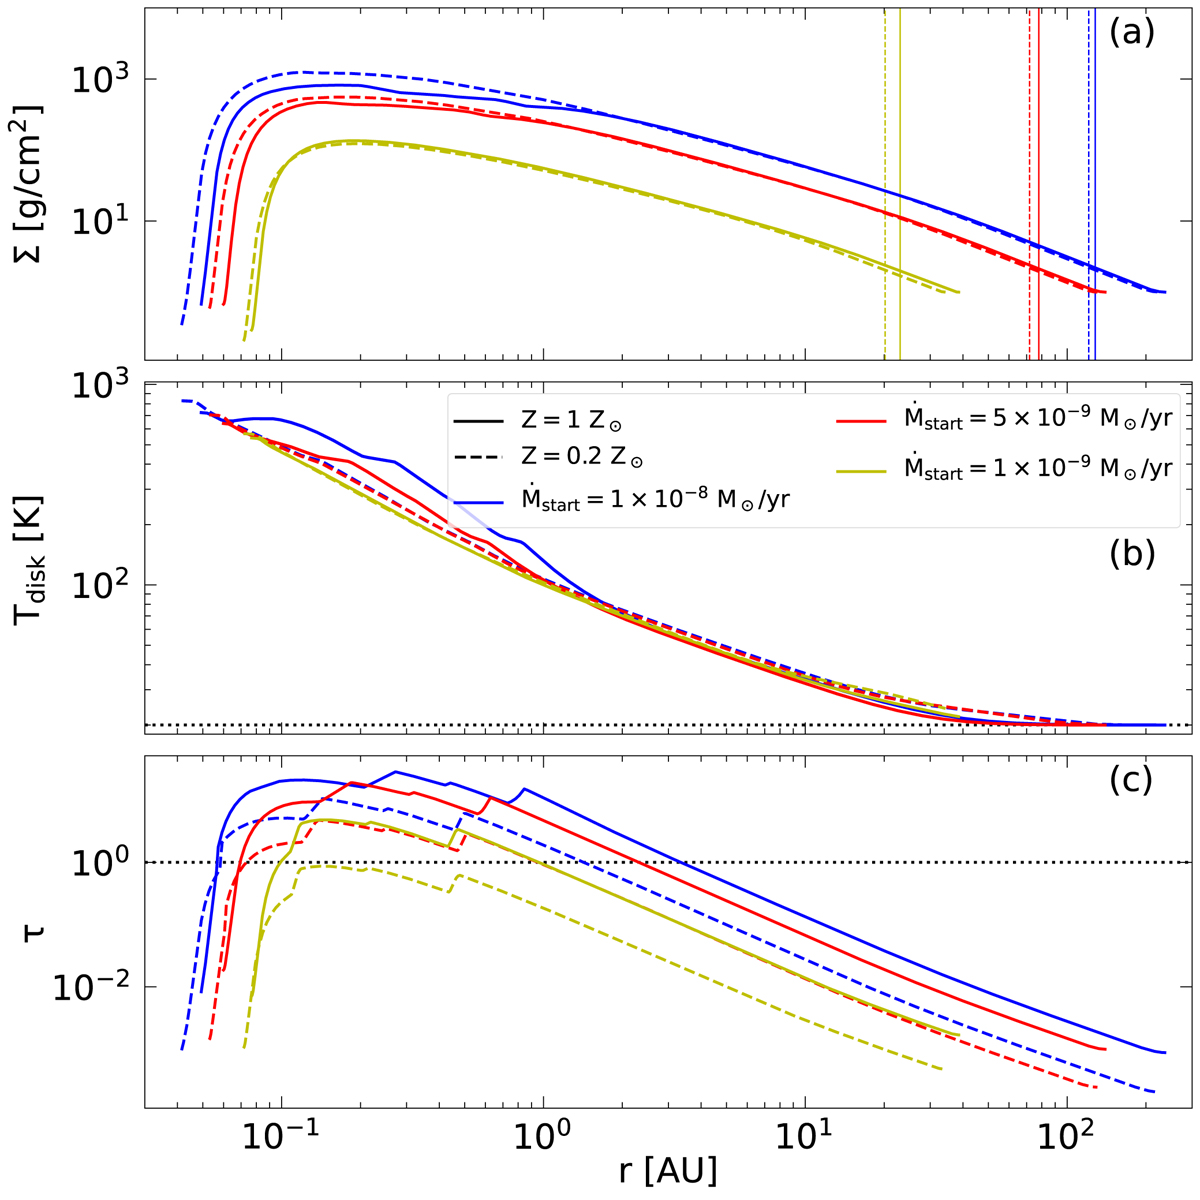
Radial profile of the initial disk model for both metallicities Z = 1 Z⊙ (solid lines) and Z = 0.2 Z⊙ (dashed lines). The yellow, red, and blue lines indicate models with Ṁstart = [1 × 10⁻⁹, 5 × 10⁻⁹, and 1 × 10⁻⁸] M⊙ yr−1, respectively. Panel a shows the disk surface density, Σ, panel b the disk midplane temperature, Tdisk, and panel c the optical depth, τ. The thin vertical lines in panel a indicate the respective position of Rc. The horizontal line in panel b indicates the ambient temperature Tamb = 20 K. The horizontal dashed line in panel c symbolizes τ = 1, which divides optically thin regions (τ ≪ 1) from optically thick regions (τ ≫ 1).
Current usage metrics show cumulative count of Article Views (full-text article views including HTML views, PDF and ePub downloads, according to the available data) and Abstracts Views on Vision4Press platform.
Data correspond to usage on the plateform after 2015. The current usage metrics is available 48-96 hours after online publication and is updated daily on week days.
Initial download of the metrics may take a while.