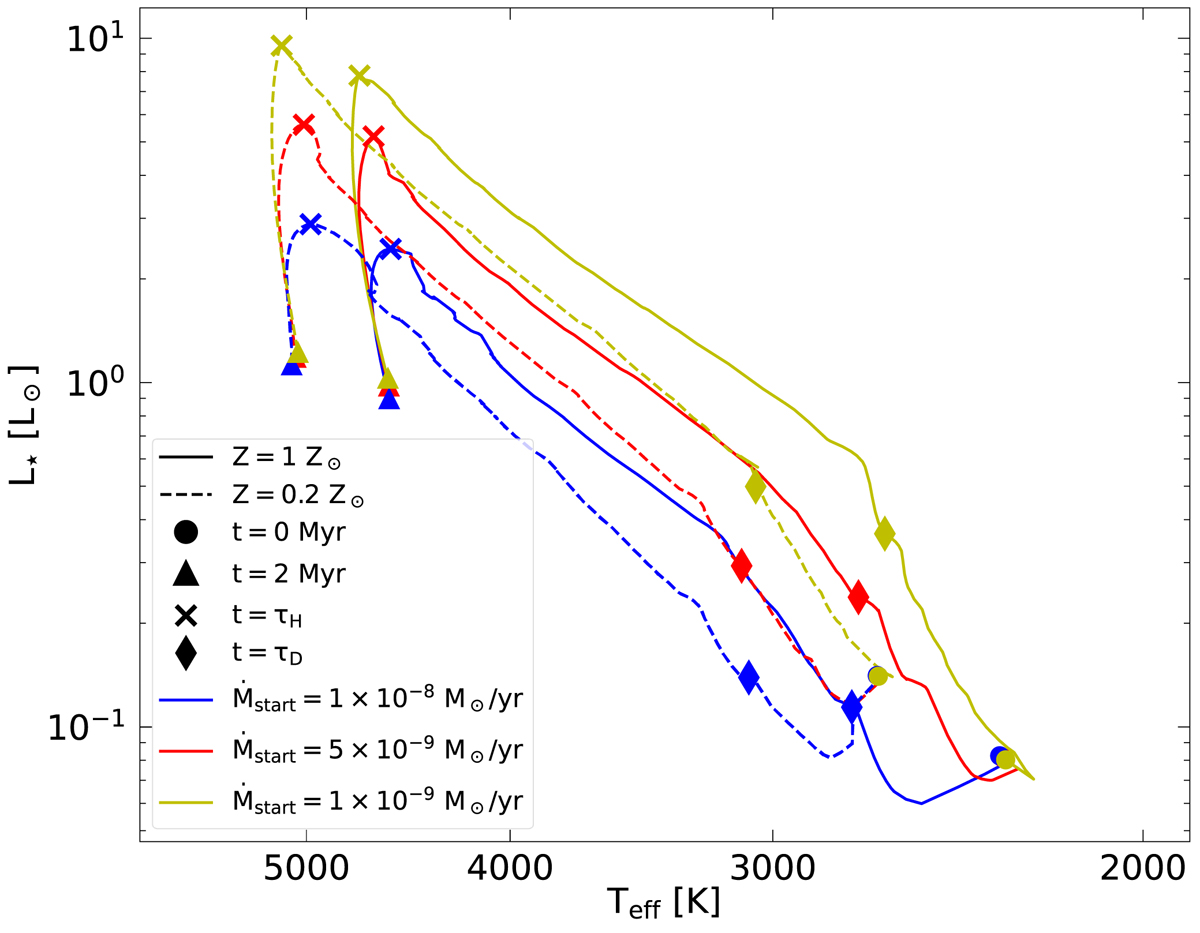
Fig. 3.
Download original image
Evolution on the HRD for t < t0 for both metallicities Z = 1 Z⊙ (solid lines) and Z = 0.2 Z⊙ (dashed lines). The values at time t = 0 Myr (t = 2 Myr) are marked with circles (triangles) and the yellow, red, and blue lines show models with Ṁstart = [1 × 10⁻⁹, 5 × 10⁻⁹, and 1 × 10⁻⁸] M⊙ yr−1, respectively. The onset of deuterium burning (t = τD) is marked with a diamond. The transition from expansion toward the Hayashi track (t = τH) is marked with a cross.
Current usage metrics show cumulative count of Article Views (full-text article views including HTML views, PDF and ePub downloads, according to the available data) and Abstracts Views on Vision4Press platform.
Data correspond to usage on the plateform after 2015. The current usage metrics is available 48-96 hours after online publication and is updated daily on week days.
Initial download of the metrics may take a while.