Fig. 2.
Download original image
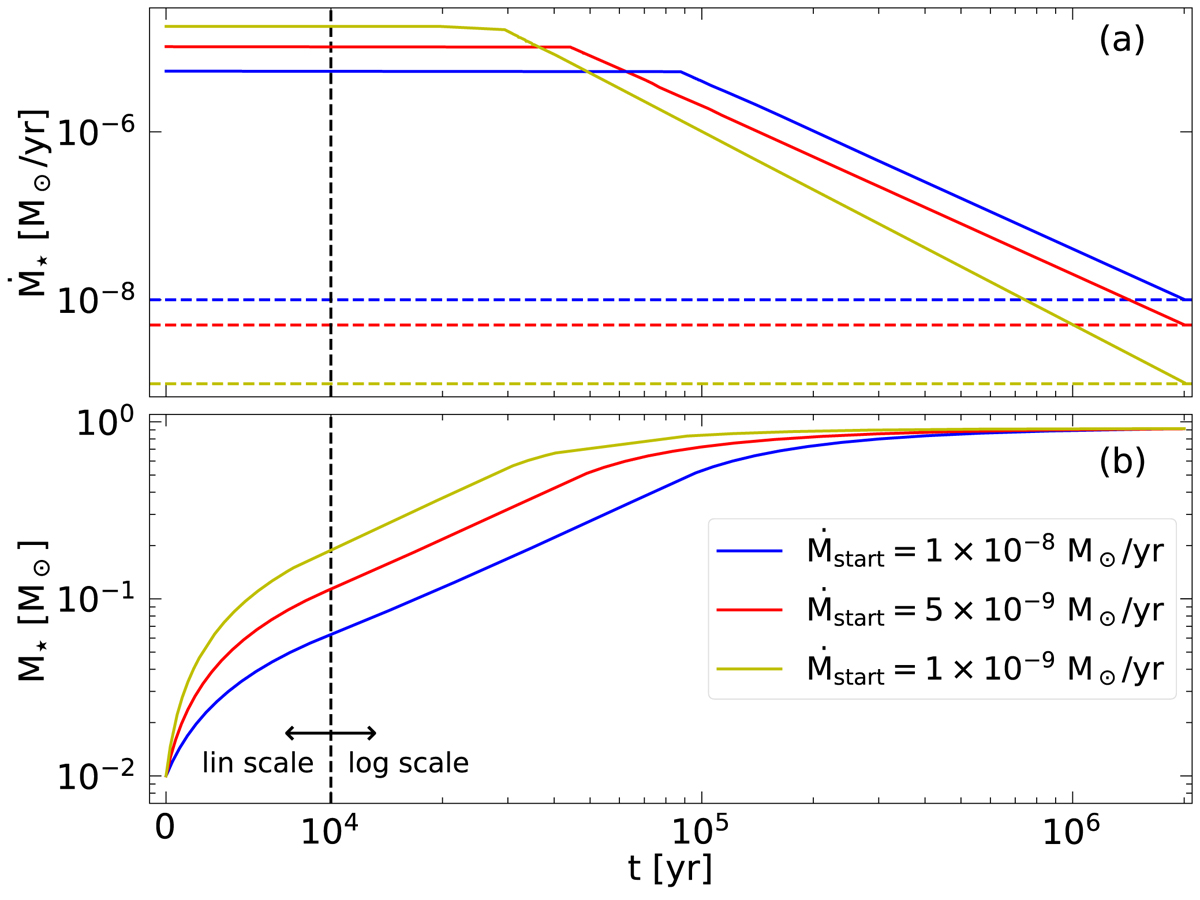
Initial stellar evolution for t < t0. Panel a: accretion history of the star. Initially, the star accretes with a constant accretion rate, Ṁinit. At time tdec, the accretion rate drops according to Ṁ⋆ ∝ t−2 (see text). The colored dashed lines show the respective value of Ṁstart. Panel b: evolution of the stellar mass. Starting from the initial mass of 0.01 M⊙, all models reach their final mass of 0.91 M⊙ after 2 Myr. The yellow, red, and blue lines show models with Ṁstart = [1 × 10⁻⁹, 5 × 10⁻⁹, and 1 × 10⁻⁸] M⊙ yr−1, respectively. To show the entire initial stellar evolution, starting from t = 0 yr, we use the symlog representation (Hunter 2007). The vertical dashed line indicates the transition from the linear scale (for t ≤ 104 yr) to the logarithmic scale (for t > 104 yr).
Current usage metrics show cumulative count of Article Views (full-text article views including HTML views, PDF and ePub downloads, according to the available data) and Abstracts Views on Vision4Press platform.
Data correspond to usage on the plateform after 2015. The current usage metrics is available 48-96 hours after online publication and is updated daily on week days.
Initial download of the metrics may take a while.