Fig. D.1.
Download original image
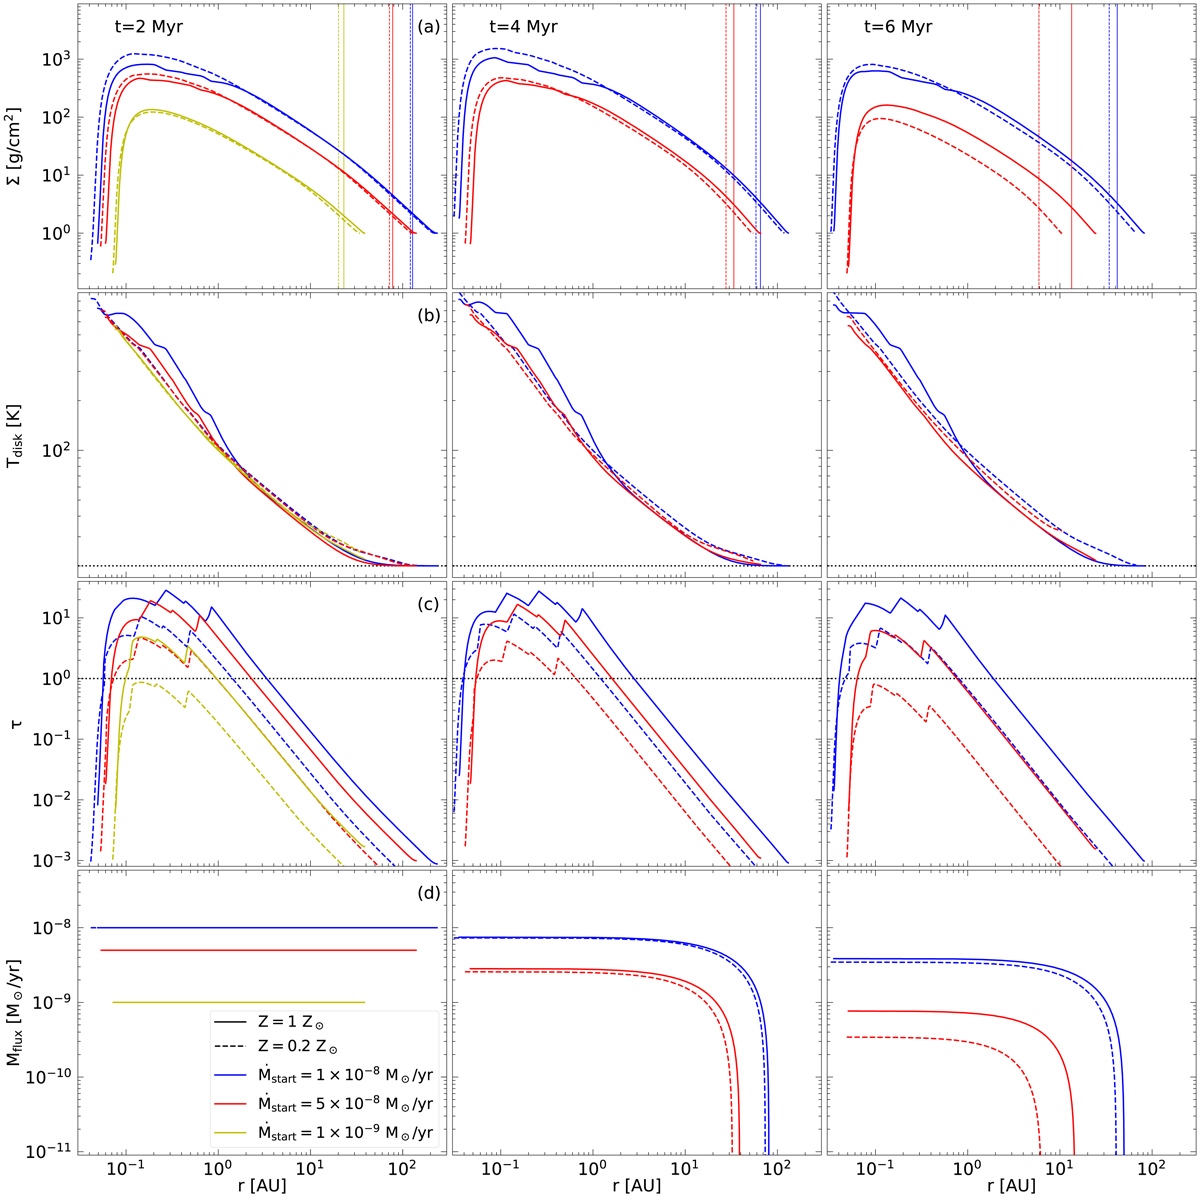
Radial profiles for the model with Ṁstart = 1.0 × 10⁻⁸ M⊙ yr−1 at the starting point of the simulation, t0 = 2 Myr (left column), as well as at 5.0 Myr (center column) and 8.0 Myr (right column). The solid (dashed) lines correspond to a metallicity of Z = 1 Z⊙ (Z = 0.2 Z⊙). Panel (a) shows the disk surface density, Σ, panel (b) the disk midplane temperature, Tdisk, panel (c) the optical depth, τ, and panel (d) the mass flux Ṁflux. The thin vertical lines in panel (a) indicate the respective position of rc. The horizontal lines in panel (b) indicate the ambient temperature Tamb = 20 K. The horizontal dashed lines in panel (c) symbolize τ = 1, dividing optically thin regions (τ ≪ 1) from optically thick regions (τ ≫ 1).
Current usage metrics show cumulative count of Article Views (full-text article views including HTML views, PDF and ePub downloads, according to the available data) and Abstracts Views on Vision4Press platform.
Data correspond to usage on the plateform after 2015. The current usage metrics is available 48-96 hours after online publication and is updated daily on week days.
Initial download of the metrics may take a while.