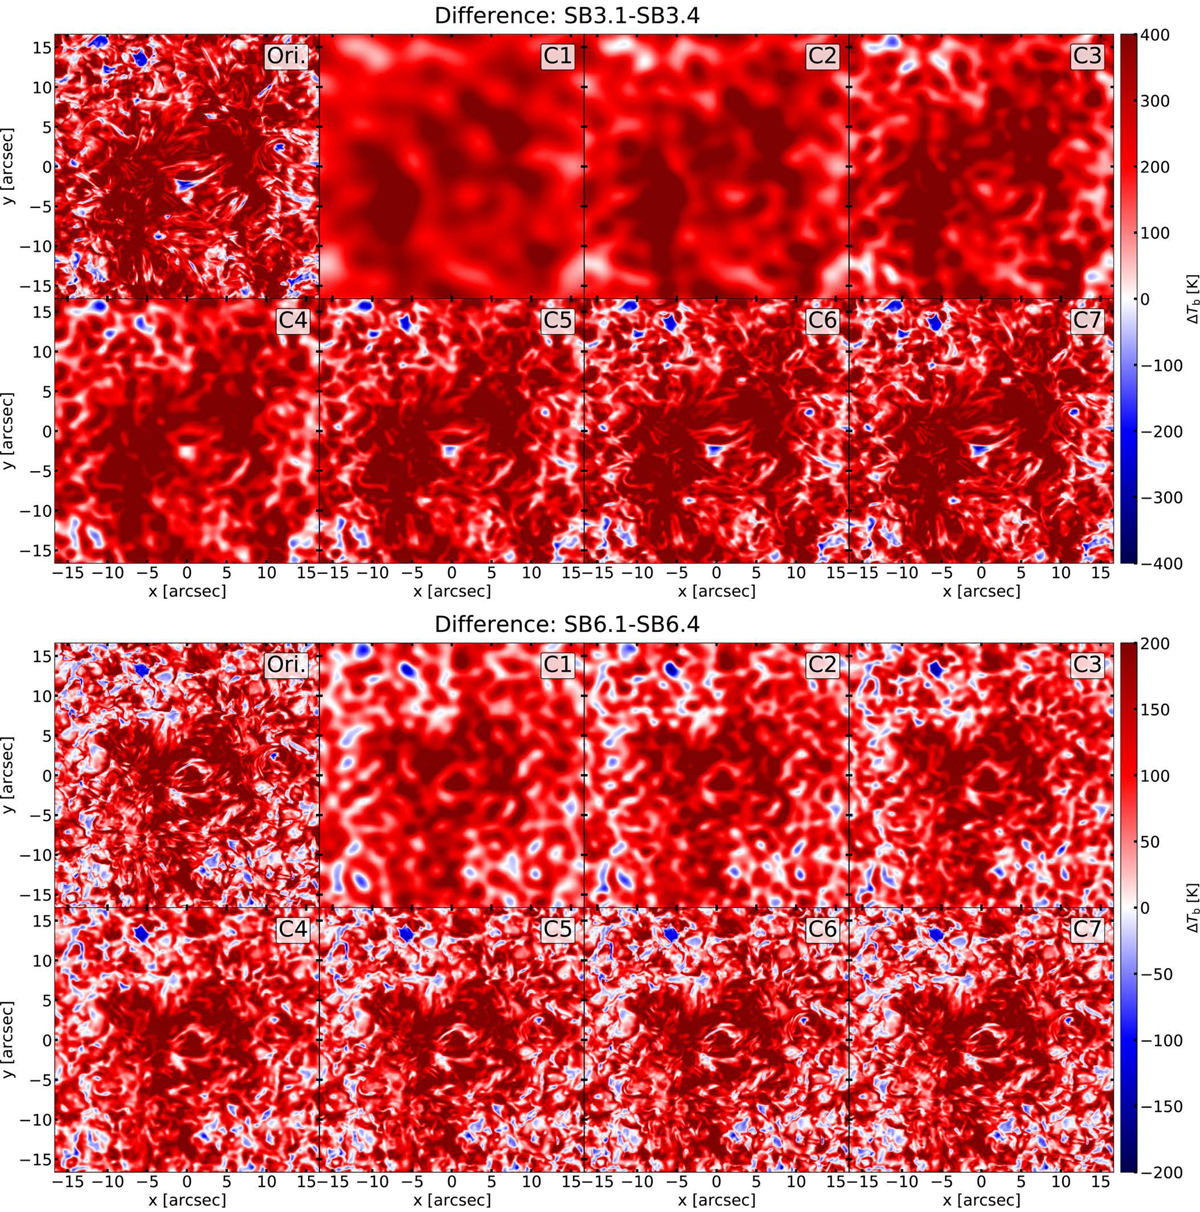
Fig. 9.
Download original image
Sub-band brightness temperature difference at band 3, ΔTb|B3, (top panels) and at band 6, ΔTb|B6, (bottom panels) at the original resolution of the numerical model and at the resolutions corresponding to array configurations C1 to C7 for the respective receiver sub-band (Table B.1). The Tb maps are individually degraded to the respective resolution before the differences were calculated.
Current usage metrics show cumulative count of Article Views (full-text article views including HTML views, PDF and ePub downloads, according to the available data) and Abstracts Views on Vision4Press platform.
Data correspond to usage on the plateform after 2015. The current usage metrics is available 48-96 hours after online publication and is updated daily on week days.
Initial download of the metrics may take a while.