Open Access
Fig. 8.
Download original image
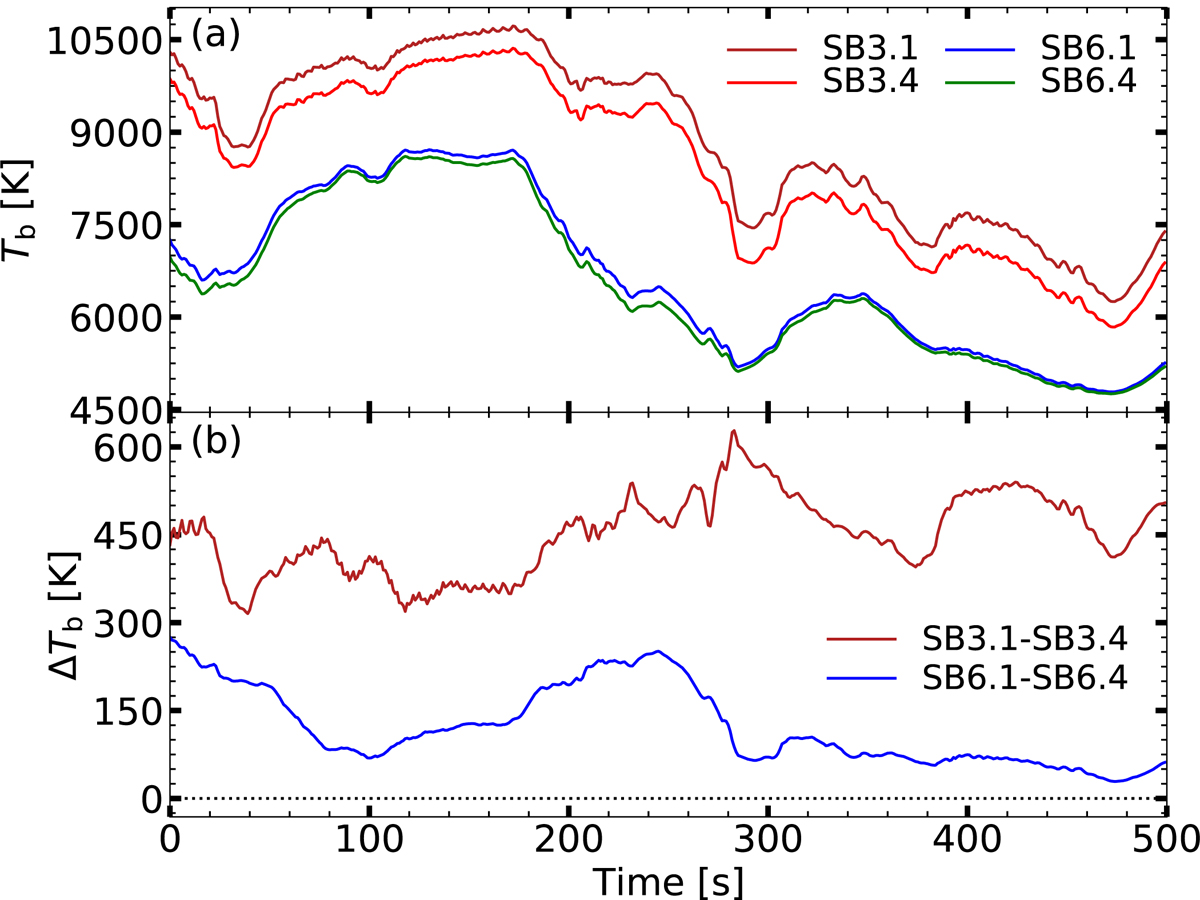
Evolution of brightness temperatures and sub-band differences at location B in the network region between t = 0–500 s. (a) Brightness temperatures of SB3.1, SB3.4, SB6.1, and SB6.4. (b) Sub-band differences ΔTb|B3 (Tb|SB3.1 − Tb|SB3.4) and ΔTb|B6 (Tb|SB6.1 − Tb|SB6.4).
Current usage metrics show cumulative count of Article Views (full-text article views including HTML views, PDF and ePub downloads, according to the available data) and Abstracts Views on Vision4Press platform.
Data correspond to usage on the plateform after 2015. The current usage metrics is available 48-96 hours after online publication and is updated daily on week days.
Initial download of the metrics may take a while.