Fig. 5.
Download original image
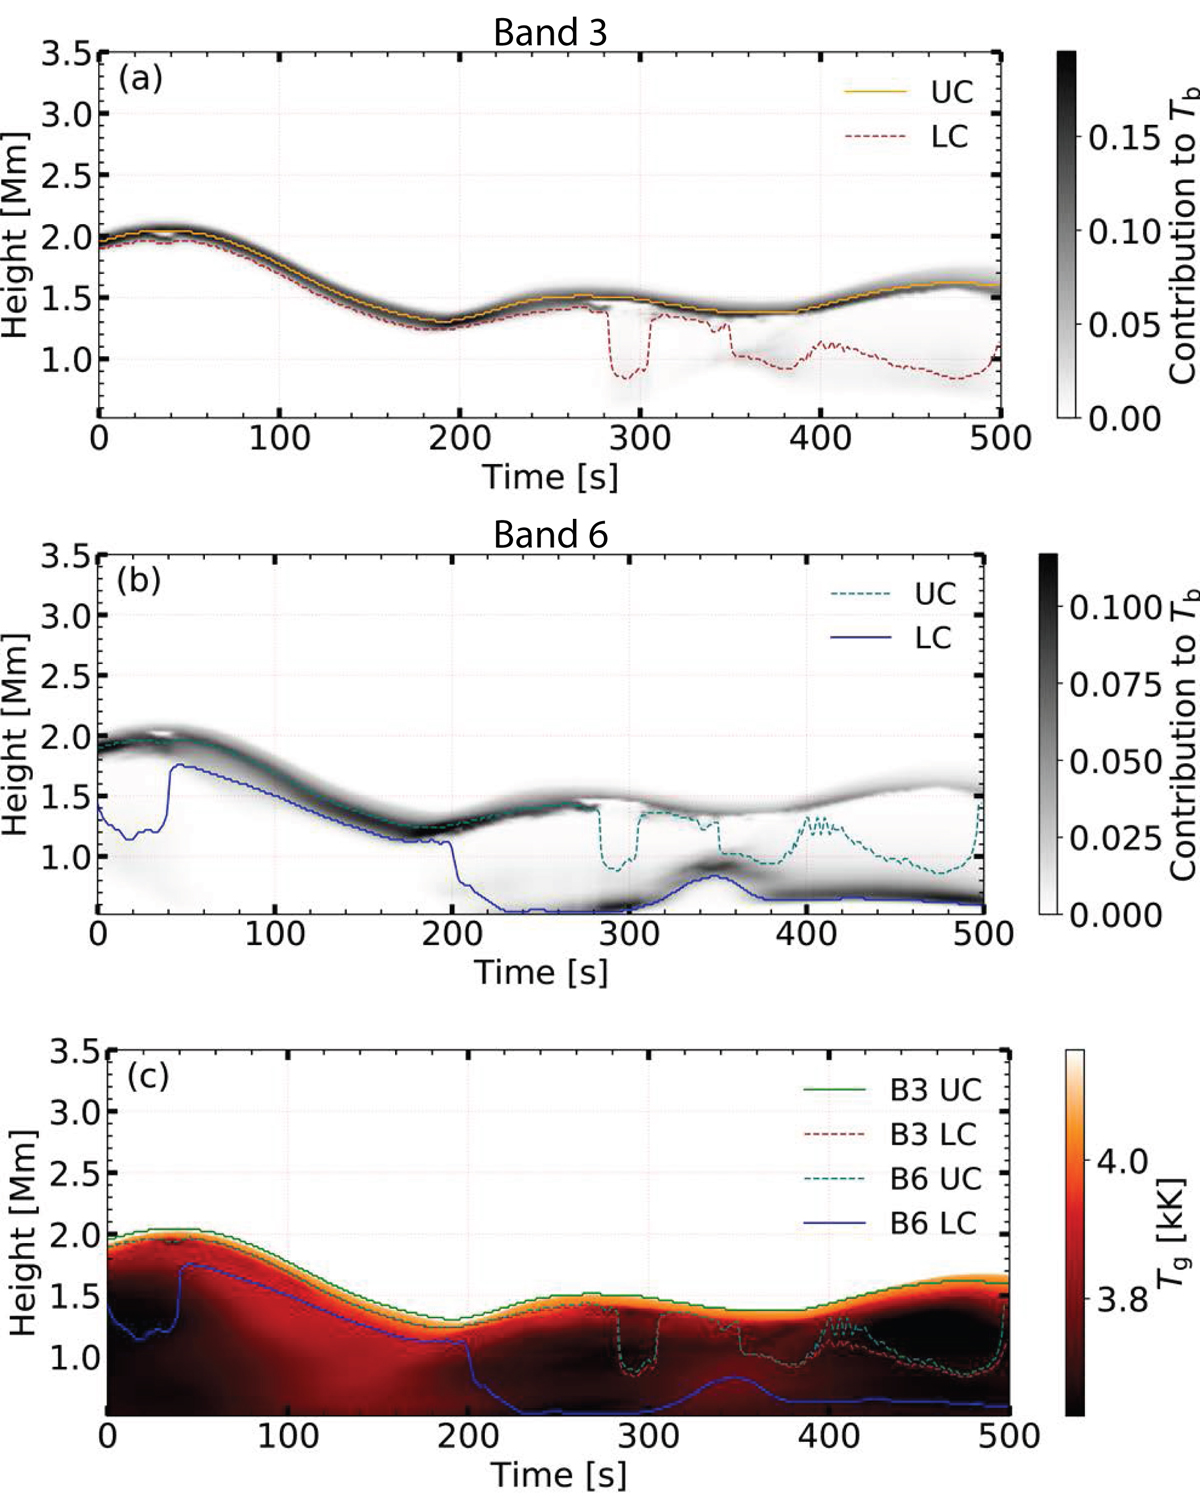
Time evolution of contribution functions and plasma temperature for a column in the network patches at (x, y)=(3.8, 4.2) arcsec, marked as location B in the FOV maps (Fig. 1). Top panel: contribution function of band 3 with heights of 0.25 and 0.8 times the contribution function integrated from the top marked by the dashed and solid lines, respectively. Middle panel: same as the top panel for band 6. Bottom panel: plasma temperature with representative formation heights of bands 3 and 6 marked with dashed and solid lines, respectively. The formation height at τ = 1.0 of both sub-bands is indicated in the respective row to facilitate comparison.
Current usage metrics show cumulative count of Article Views (full-text article views including HTML views, PDF and ePub downloads, according to the available data) and Abstracts Views on Vision4Press platform.
Data correspond to usage on the plateform after 2015. The current usage metrics is available 48-96 hours after online publication and is updated daily on week days.
Initial download of the metrics may take a while.