Fig. 4.
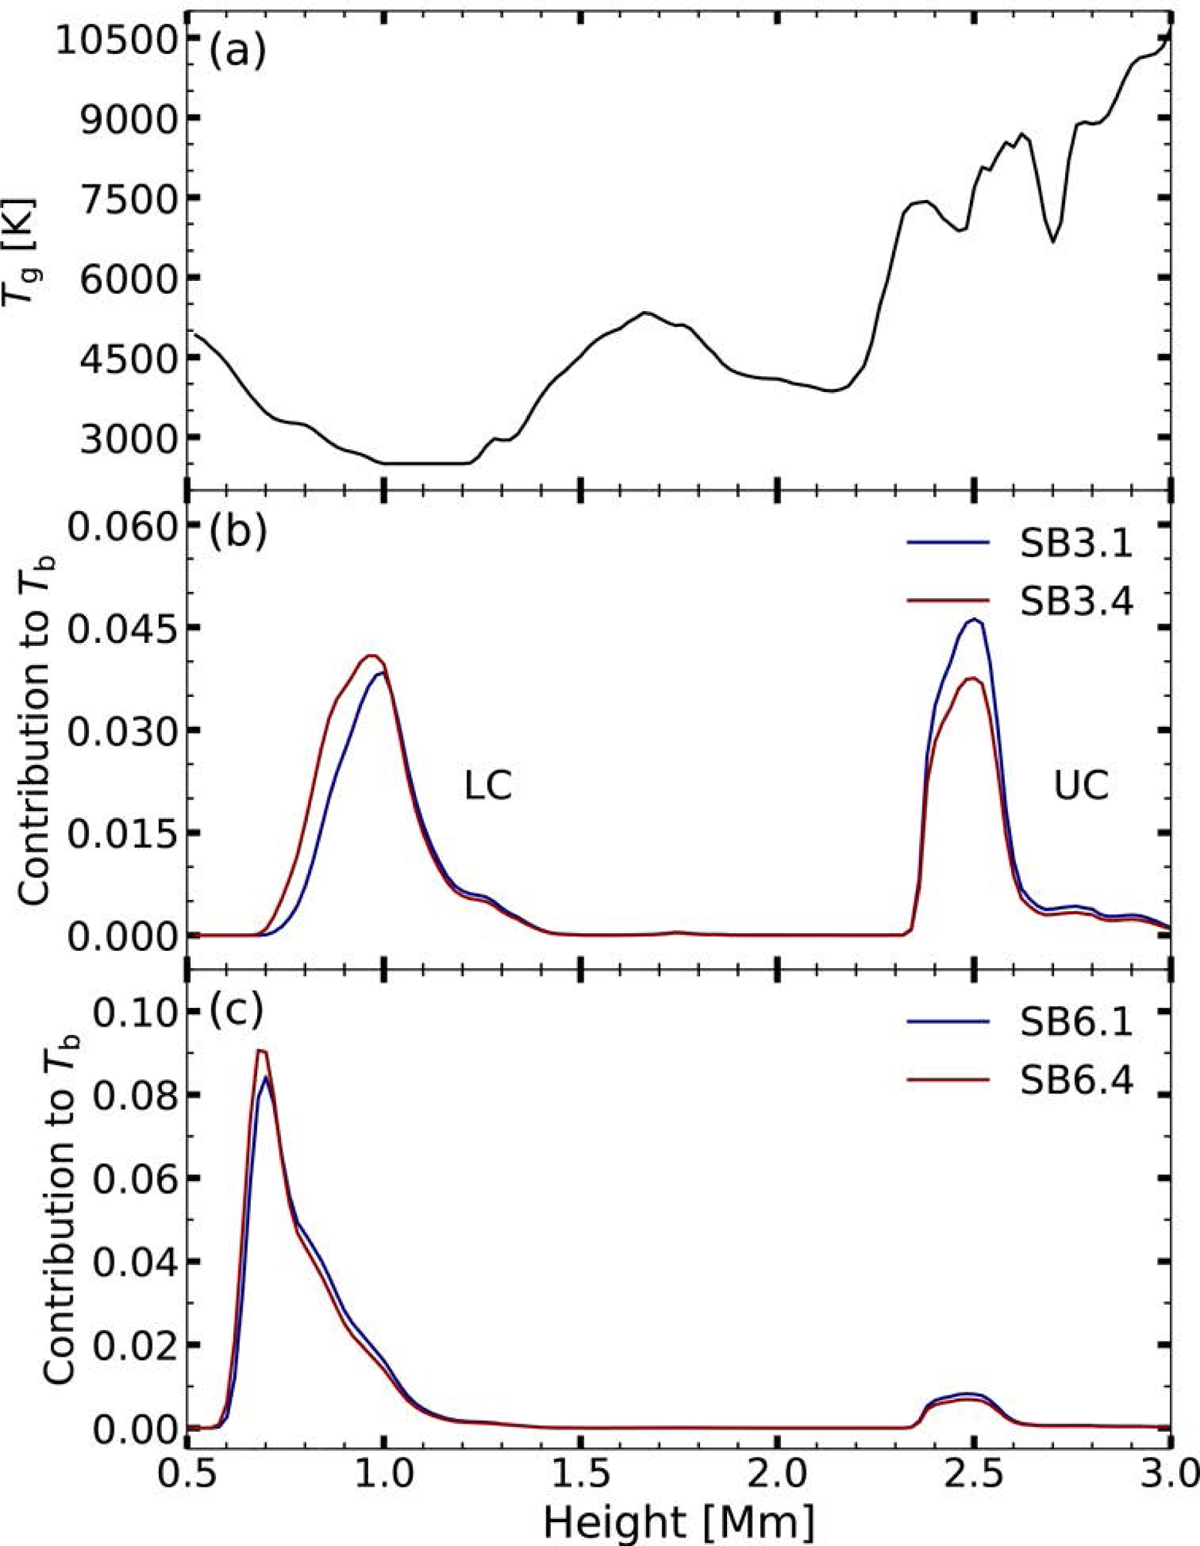
Download original image
Plasma temperature and contribution functions plotted against height in the atmosphere for one time step, tex = 120 s, of the shock wave (see, Fig. 3) at location A (Fig. 1). (a) Plasma temperature as function of height. (b) Contribution functions of SB3.1 and SB3.4, each showing a lower and an upper component, marked LC and UC, respectively. (c) Contribution functions of SB6.1 and SB6.4.
Current usage metrics show cumulative count of Article Views (full-text article views including HTML views, PDF and ePub downloads, according to the available data) and Abstracts Views on Vision4Press platform.
Data correspond to usage on the plateform after 2015. The current usage metrics is available 48-96 hours after online publication and is updated daily on week days.
Initial download of the metrics may take a while.