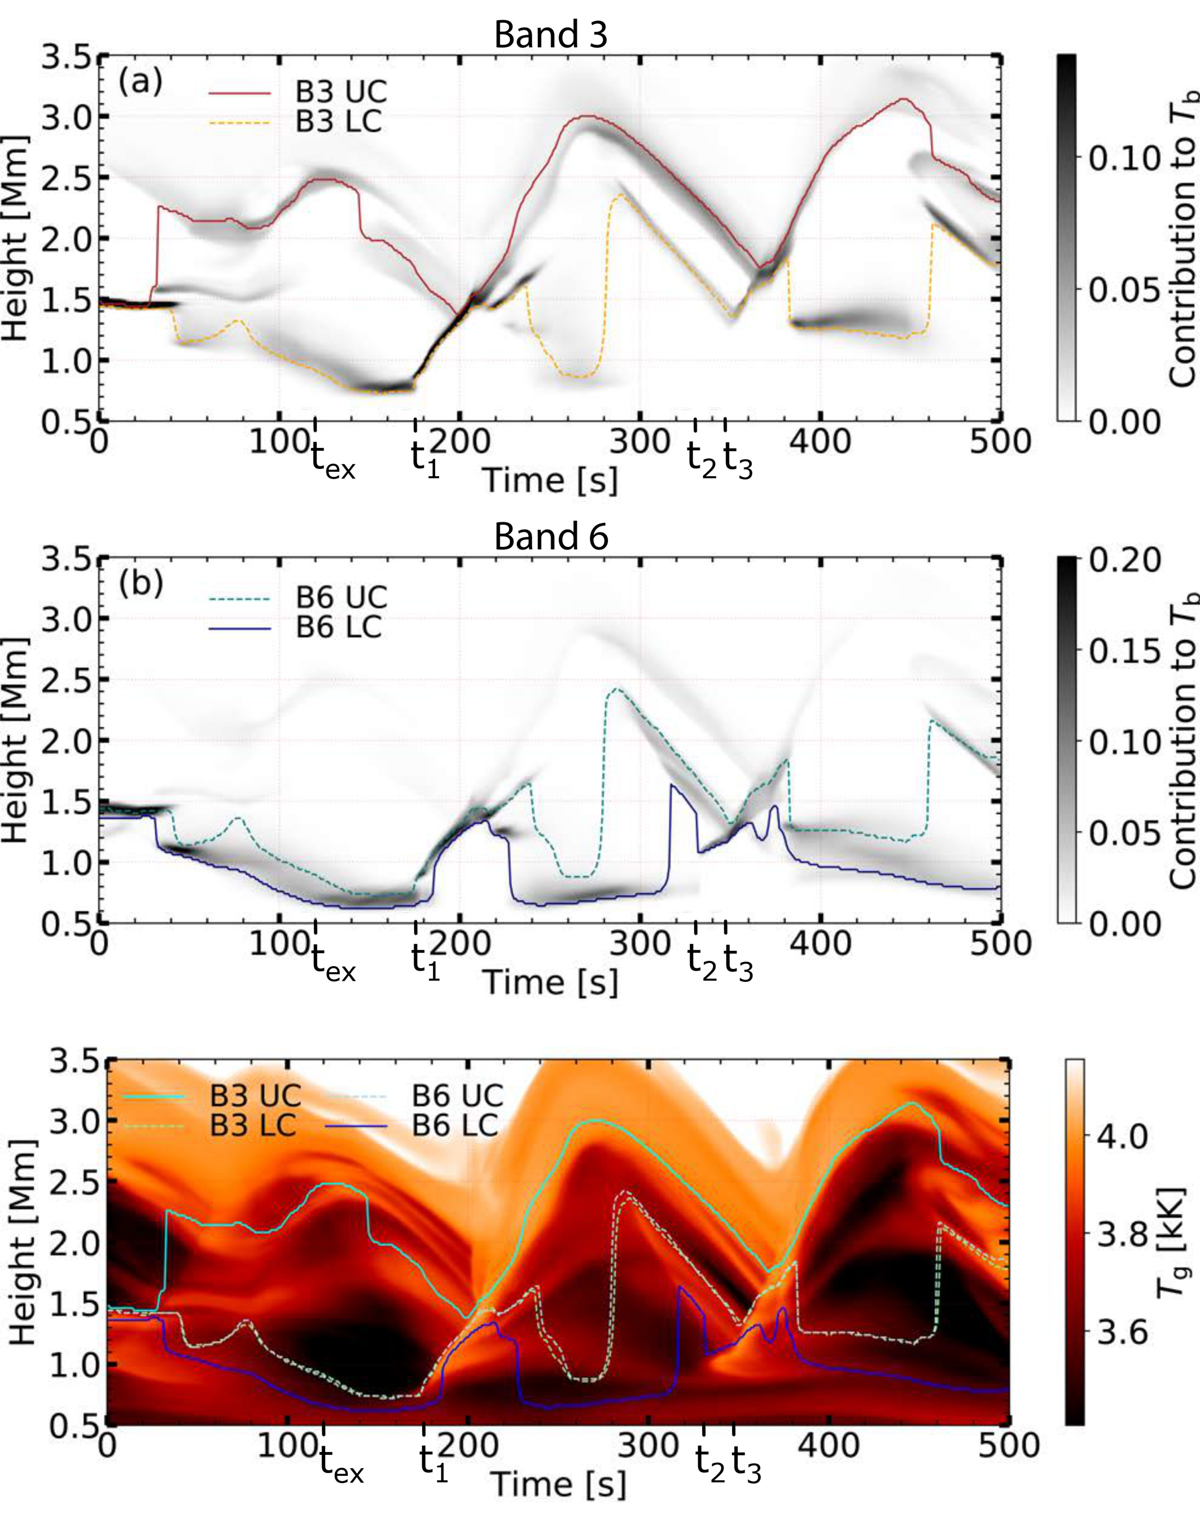
Fig. 3.
Download original image
Time evolution of contribution functions and plasma temperature for a column in the quiet Sun at location A (Fig. 1), with the shock-wave event studied in detail in Eklund et al. (2021a). The contribution function of band 3 (a) and band 6 (b) with heights of 0.25 and 0.80 times the contribution function integrated from the top is marked by the dashed and solid lines, respectively. (c) Plasma temperature with each of the representative heights of the two components of bands 3 and 6 marked for reference. The ticks tex and t1 – t3 mark the times for the in-depth discussion in connection to Figs. 4 and 7.
Current usage metrics show cumulative count of Article Views (full-text article views including HTML views, PDF and ePub downloads, according to the available data) and Abstracts Views on Vision4Press platform.
Data correspond to usage on the plateform after 2015. The current usage metrics is available 48-96 hours after online publication and is updated daily on week days.
Initial download of the metrics may take a while.