Fig. A.1.
Download original image
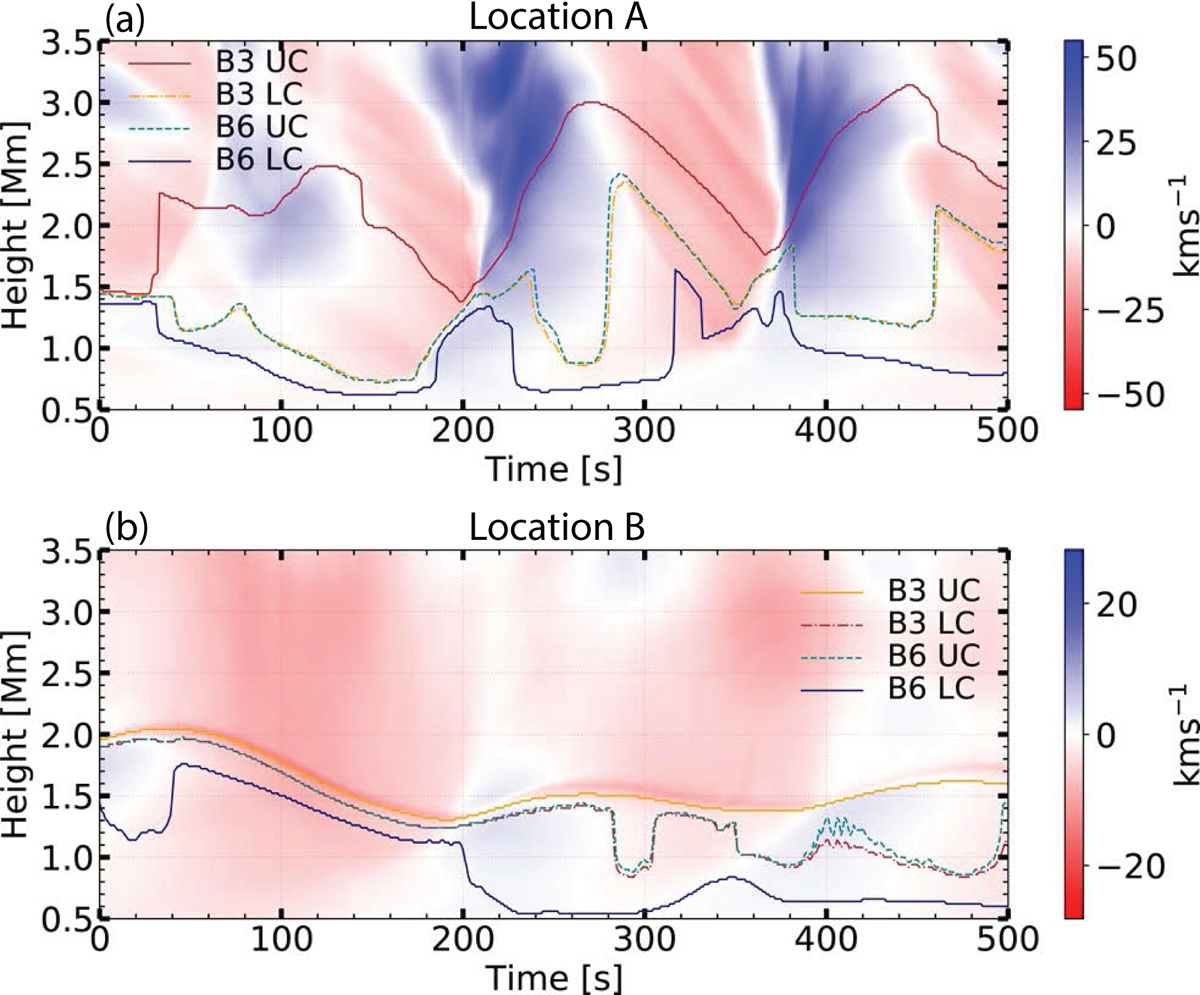
Time evolution of the vertical velocities of the columns at location A during the propagation of shock waves (a) and at location B in the network region (b). Upward motion, away from the photosphere, is indicated by negative velocity (blue). The representative formation heights of the lower and upper components of the observables for bands 3 and 6 are marked by the solid and dashed lines, respectively (see Sect. 3 in the main text for details).
Current usage metrics show cumulative count of Article Views (full-text article views including HTML views, PDF and ePub downloads, according to the available data) and Abstracts Views on Vision4Press platform.
Data correspond to usage on the plateform after 2015. The current usage metrics is available 48-96 hours after online publication and is updated daily on week days.
Initial download of the metrics may take a while.