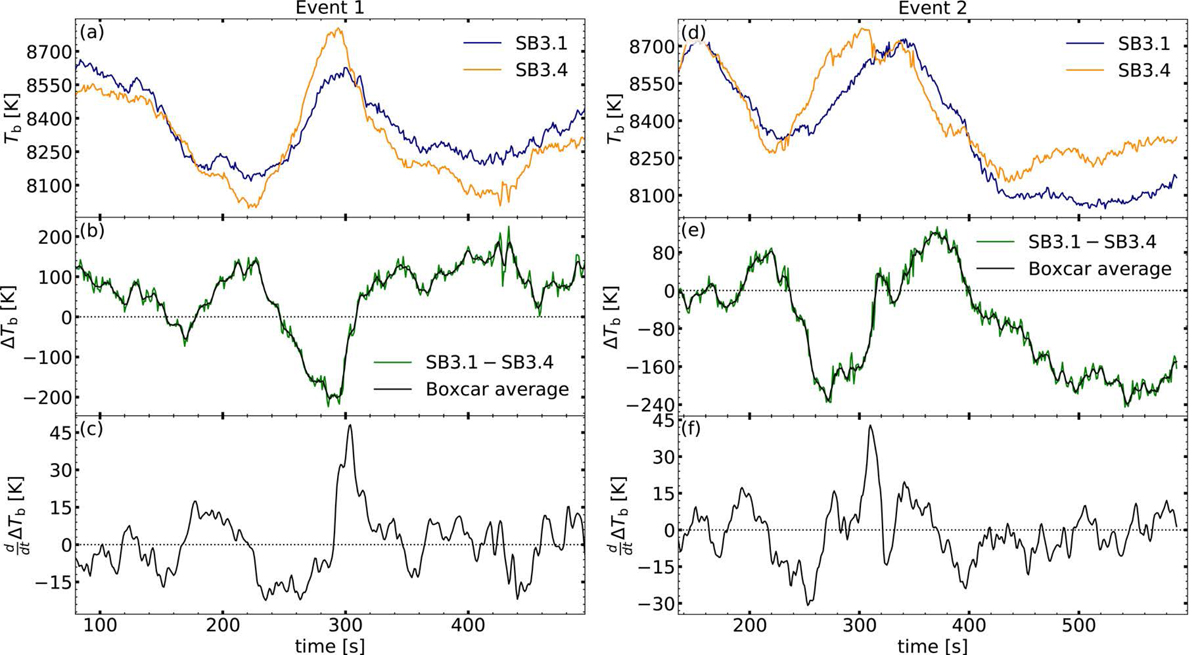
Fig. 12.
Download original image
Temporal evolution of the brightness temperatures at of the two selected brightenings in the observational data. Left column: Event 1. Right column: Event 2. The locations of the events are indicated in the FOV of Fig. 11. (a,d) Brightness temperatures of SB3.1 and SB3.4. (b,e) Brightness temperature differences between the sub-bands ΔTb|B3. The green graph shows the original data, and the black curve schows a boxcar average over 10 s. (c,f) Time derivative of the (boxcar-averaged) sub-band differences.
Current usage metrics show cumulative count of Article Views (full-text article views including HTML views, PDF and ePub downloads, according to the available data) and Abstracts Views on Vision4Press platform.
Data correspond to usage on the plateform after 2015. The current usage metrics is available 48-96 hours after online publication and is updated daily on week days.
Initial download of the metrics may take a while.