Fig. 11.
Download original image
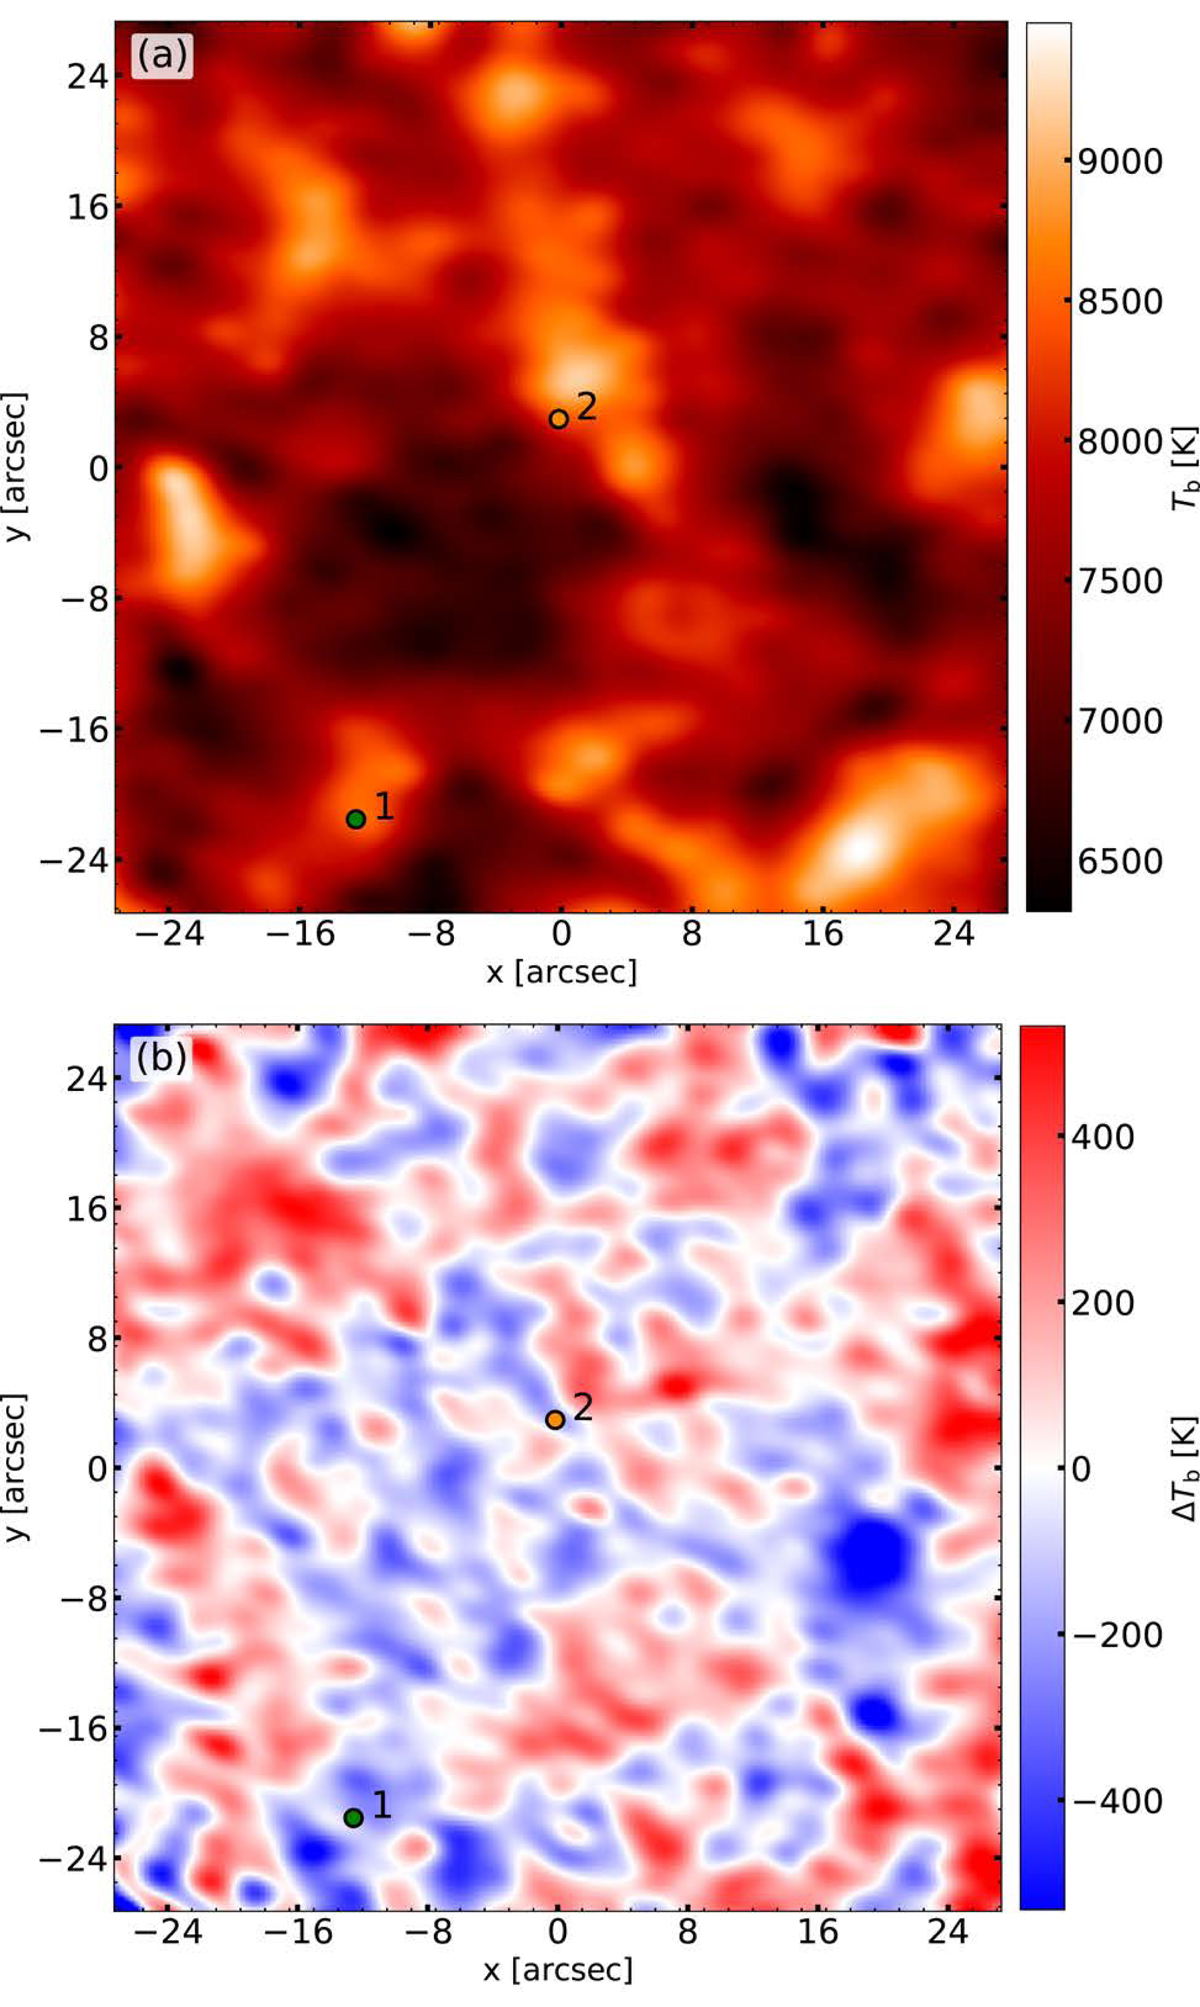
Brightness temperature and sub-band brightness temperature difference of the FOV of the observational band 3 data at t = 290 s. (a) Brightness temperature of SB3.1 as constructed by adding the total power data to the interferometric data. (b) Difference of the brightness temperature between the sub-bands, ΔTb|B3 = Tb|SB3.1 − Tb|SB3.4 derived from the interferometric data at each sub-band. The span of ΔTb|B3 is between −1150 K and 670 K, but the colour scale was limited to −500 K to 500 K to reveal the small-scale structures. The locations of the two selected brightening events are marked by the green and orange markers.
Current usage metrics show cumulative count of Article Views (full-text article views including HTML views, PDF and ePub downloads, according to the available data) and Abstracts Views on Vision4Press platform.
Data correspond to usage on the plateform after 2015. The current usage metrics is available 48-96 hours after online publication and is updated daily on week days.
Initial download of the metrics may take a while.