Fig. 10.
Download original image
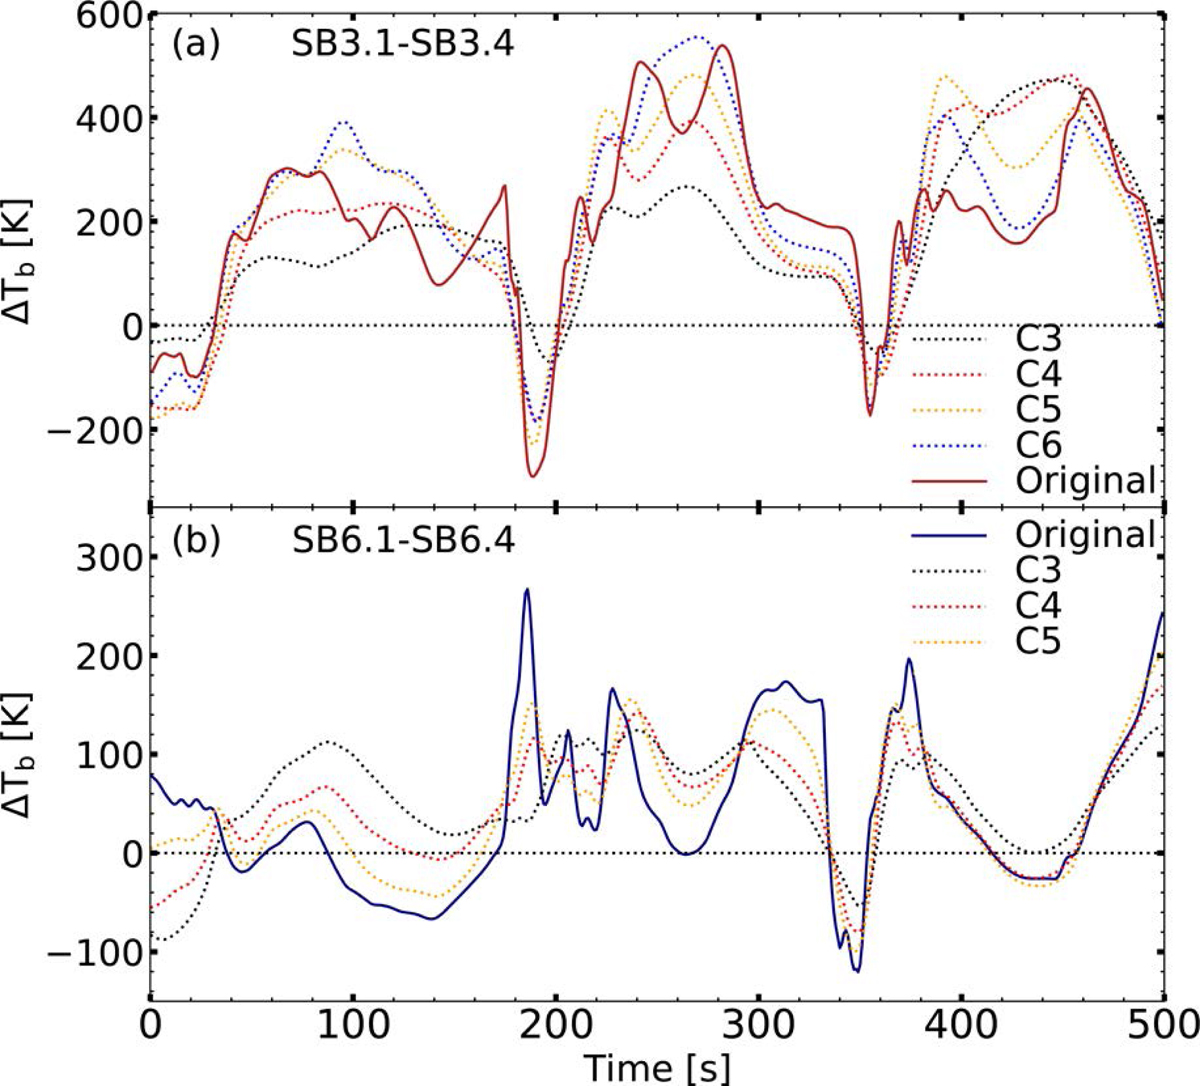
Time evolution of the sub-band Tb differences of the time series at location A at the different angular resolutions. (a) Tb difference between sub-bands 3.1 and 3.4 at the original resolution (solid red line) and at the degraded resolutions corresponding to array configurations C3, C4, C5, and C6 (coloured dotted lines). (b) Tb difference between sub-bands 6.1 and 6.4 at the original resolution (solid blue line) and at the degraded resolutions corresponding to array configurations C3, C4, and C5 (coloured dotted lines). The horizontal dotted black lines show the level of ΔTb = 0.
Current usage metrics show cumulative count of Article Views (full-text article views including HTML views, PDF and ePub downloads, according to the available data) and Abstracts Views on Vision4Press platform.
Data correspond to usage on the plateform after 2015. The current usage metrics is available 48-96 hours after online publication and is updated daily on week days.
Initial download of the metrics may take a while.