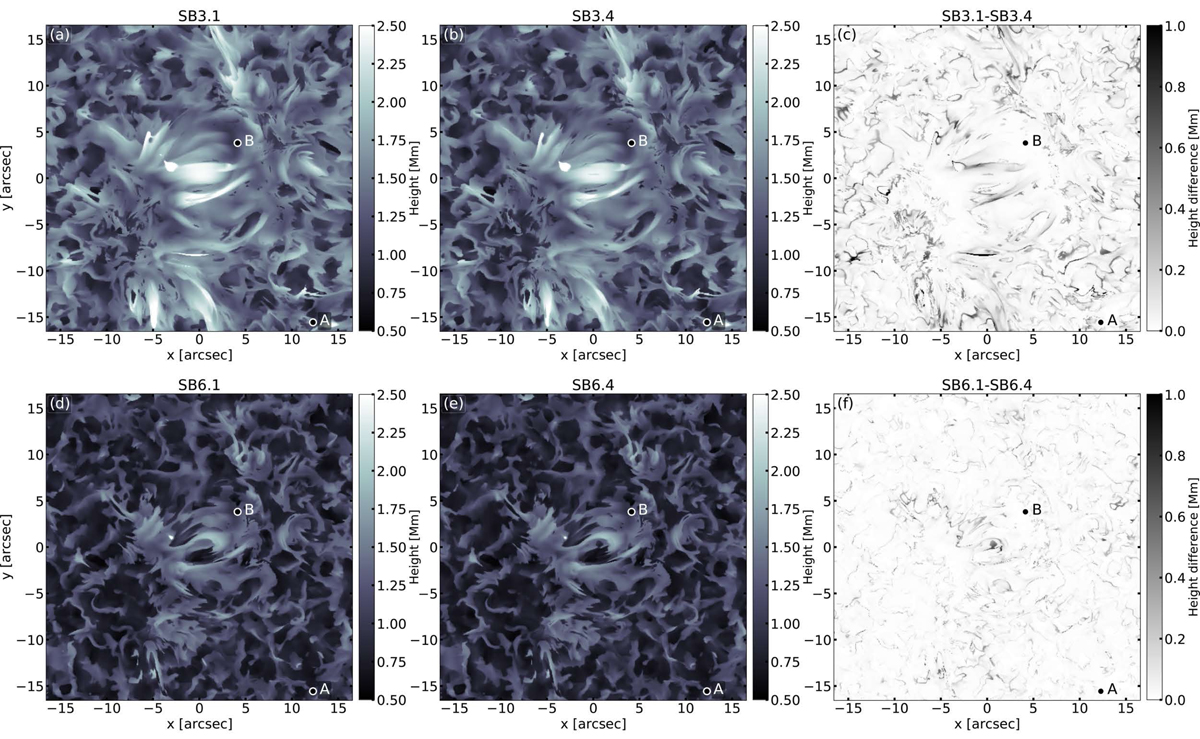
Fig. 1.
Download original image
Formation hieght of the radiation at (a) SB3.1 (τ3.2 mm = 1.0), (b) SB3.4 (τ2.8 mm = 1.0), (c) difference in height between SB3.1 and SB3.4, (d) SB6.1 (τ1.3 mm = 1.0), (e) SB6.4 (τ1.2 mm = 1.0) and (f) difference in height between SB3.1 and SB3.4. The selected locations A and B for the time-series analysis (Figs. 3–5) are marked for reference. The colour scale of the sub-band differences (c) and (f) are positive at all times (they are not absolute) and are capped to 1.0 Mm from 1.42 Mm at band 3 (c) and 1.17 Mm at band 6 (f) in order to reveal the small-scale structures.
Current usage metrics show cumulative count of Article Views (full-text article views including HTML views, PDF and ePub downloads, according to the available data) and Abstracts Views on Vision4Press platform.
Data correspond to usage on the plateform after 2015. The current usage metrics is available 48-96 hours after online publication and is updated daily on week days.
Initial download of the metrics may take a while.