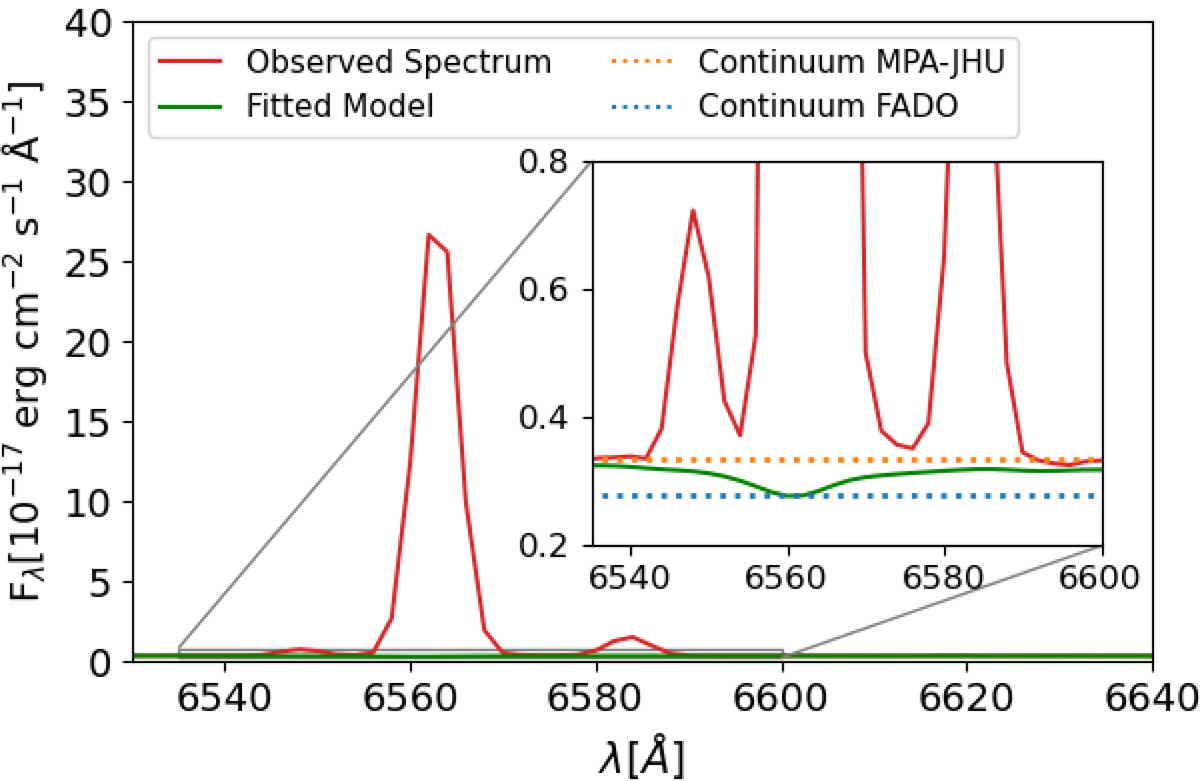
Fig. 4.
Download original image
Comparison of the definition of the continuum for FADO and MPA-JHU for the Hα line. The red line is the observed spectrum, and the green line is the fitted model. The dashed orange line represents the continuum as defined from averaging the level of the continuum adjacent to the emission line (MPA-JHU definition). The dashed blue line represents the continuum considering the bottom of the absorption feature below the emission line (FADO definition).
Current usage metrics show cumulative count of Article Views (full-text article views including HTML views, PDF and ePub downloads, according to the available data) and Abstracts Views on Vision4Press platform.
Data correspond to usage on the plateform after 2015. The current usage metrics is available 48-96 hours after online publication and is updated daily on week days.
Initial download of the metrics may take a while.