Fig. 6.
Download original image
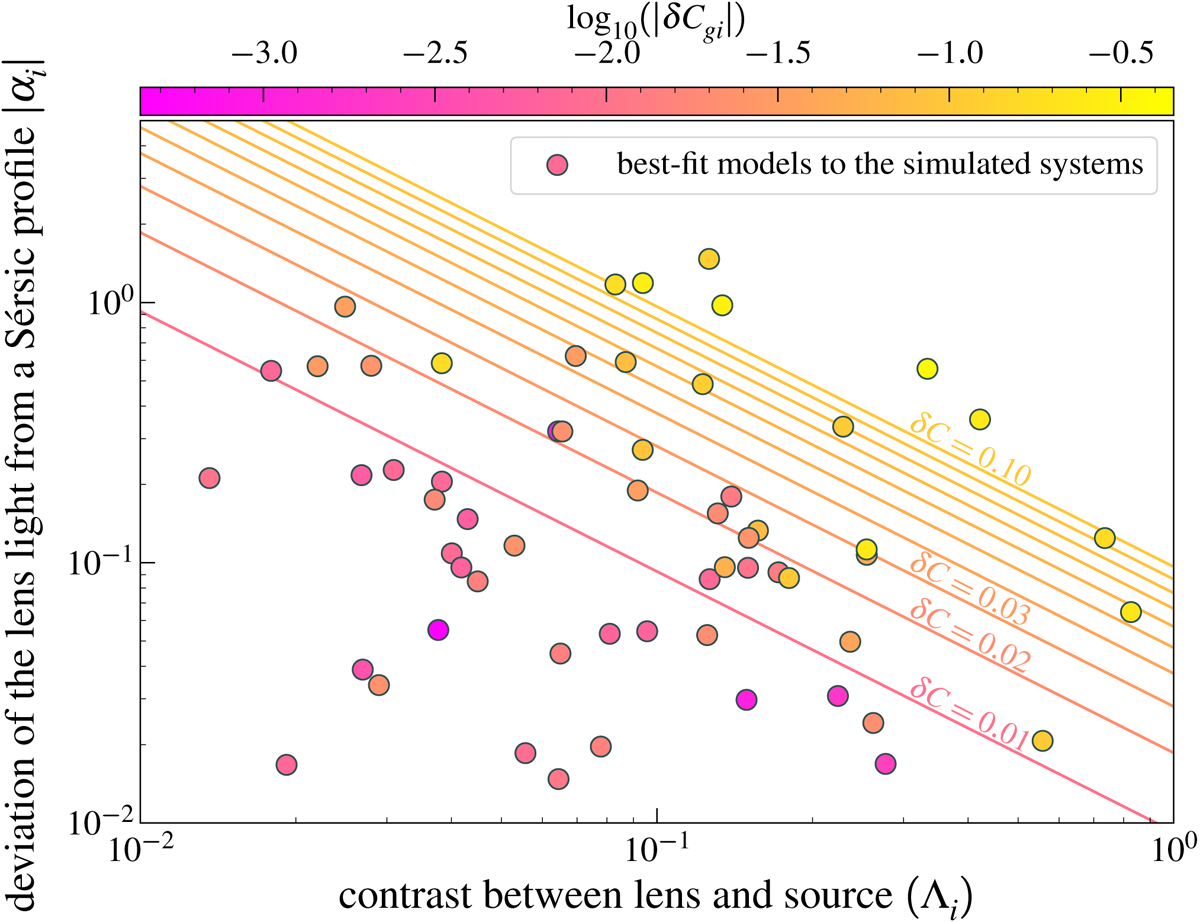
Highest allowed deviation of the lens light from a Sérsic profile (αi) as a function of the i-band contrast between the lens and source image (Λi) to achieve source colour measurements that are more accurate than a set threshold. The solid lines are generated from the derived correlation between δCgi, Λi, and αi (Eq. (12)). Each solid line shows αi as a function of Λi, for a constant δCgi. The value of δCgi increases from 0.01 to 0.1, in 0.01 intervals (from bottom to top). The scattered data points show the distribution of αi and Λi for the best-fit models to the simulated systems. The scattered data points are colour-coded with the δCgi values of the best-fit models. In agreement with the derived correlation (Eq. (12)), the δCgi of the best-fit models increases perpendicularly to the solid constant δCgi lines. This figure indicates that Λi is the main parameter that determines the maximum allowed αi to have δCgi below a desired threshold.
Current usage metrics show cumulative count of Article Views (full-text article views including HTML views, PDF and ePub downloads, according to the available data) and Abstracts Views on Vision4Press platform.
Data correspond to usage on the plateform after 2015. The current usage metrics is available 48-96 hours after online publication and is updated daily on week days.
Initial download of the metrics may take a while.