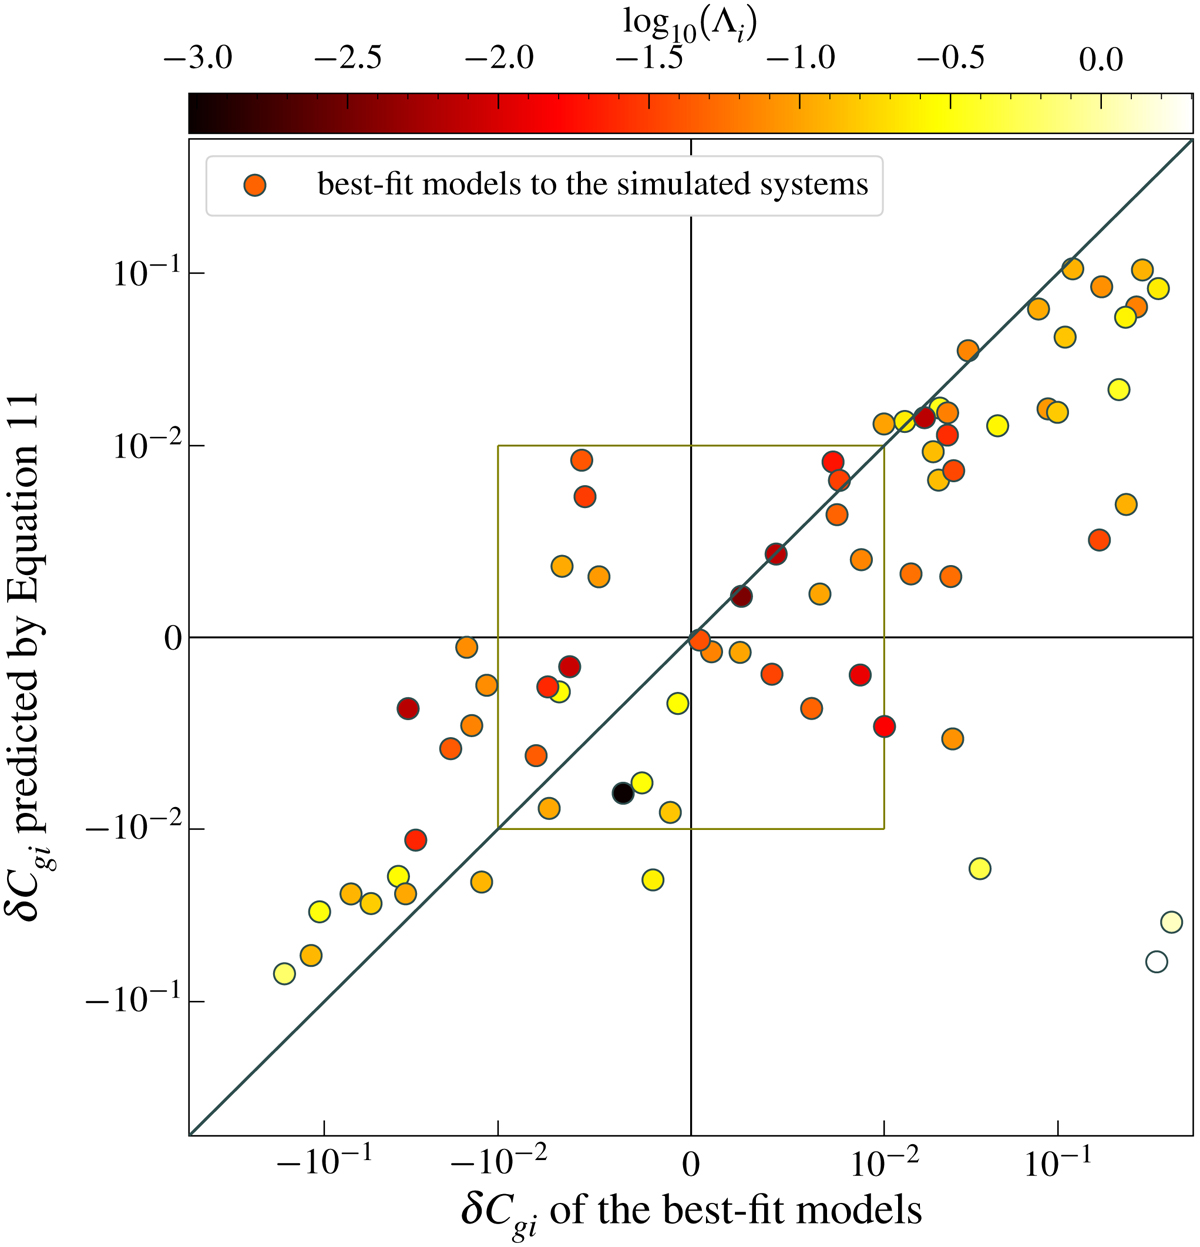
Fig. 5.
Download original image
Source g − i colour measurement error δCgi as predicted by inserting the αi, αg, Λi, and Λg (i-band and g-band deviation of the lens light from a Sérsic profile, and i-band and g-band ratio of the lens to source surface brightness measured at the image locations, respectively) of the best-fit models into Eq. (11) (derived correlation between δCgi, α, and Λ), plotted against the true δCgi of the best-fit models. The diagonal solid black line indicates were the predicted and true δCgi are equal. The data point for each simulated system is colour-coded with its Λi value. The data points are plotted linearly within the inner olive box.
Current usage metrics show cumulative count of Article Views (full-text article views including HTML views, PDF and ePub downloads, according to the available data) and Abstracts Views on Vision4Press platform.
Data correspond to usage on the plateform after 2015. The current usage metrics is available 48-96 hours after online publication and is updated daily on week days.
Initial download of the metrics may take a while.