Fig. 4.
Download original image
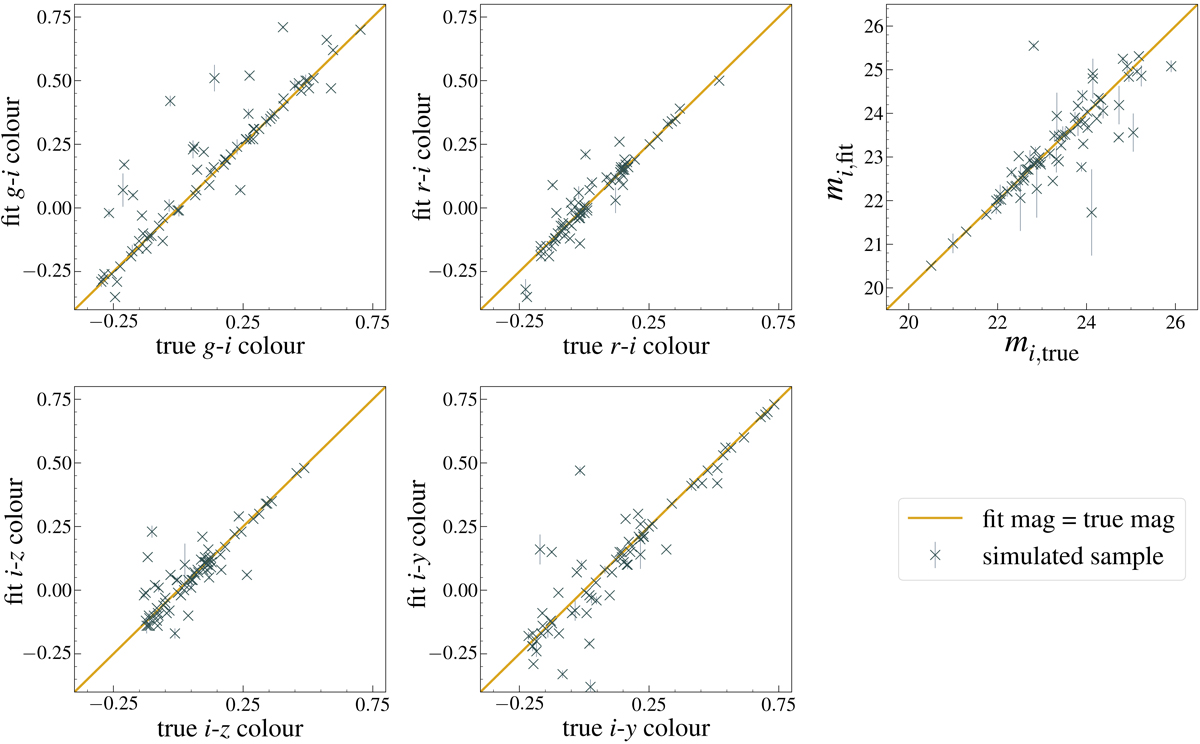
Best-fit vs. true g − i, r − i, i − z, and i − y source colours (four left panels), and the best-fit vs. true source i-band magnitudes (top right panel), for 73 strongly lensed galaxy–galaxy systems in our simulated sample. The dark yellow lines indicate where the fitted values equal the true values. The error bars show the 1σ uncertainties inferred from the MCMC chains. The best-fit i-band magnitudes have a 0.07 bias around their true values and a 0.29 standard deviation. The best-fit g − i, r − i, i − z, and i − y colours have 0.007, −0.002, −0.006, and −0.015 bias around their true values and 0.03, 0.02, 0.03, and 0.06 standard deviations, respectively. The colour measurement is much more accurate than the magnitude measurement.
Current usage metrics show cumulative count of Article Views (full-text article views including HTML views, PDF and ePub downloads, according to the available data) and Abstracts Views on Vision4Press platform.
Data correspond to usage on the plateform after 2015. The current usage metrics is available 48-96 hours after online publication and is updated daily on week days.
Initial download of the metrics may take a while.