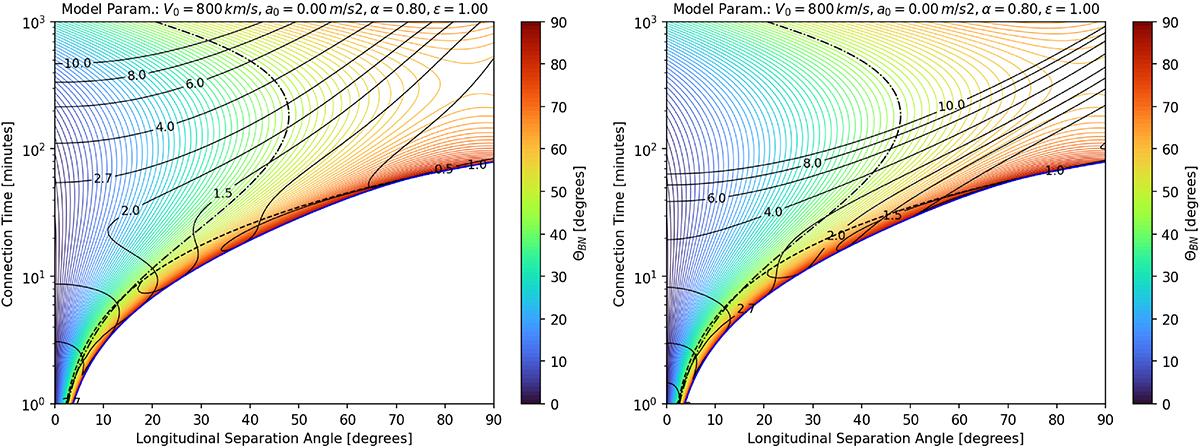
Fig. 6.
Download original image
Plots similar to those presented in Fig. 5, showing the disturbance connection times as a function of the longitudinal separation angle. Here an expansion speed of 800 km s−1 and α = 0.8 are used in both panels. The black contour lines show the evolution of MA values for different angles and times. The MA were calculated using two different coronal models for the variation in density with the heliocentric distance. For the left panel, we used the Saito model and for the right panel, we used the Newkirk model.
Current usage metrics show cumulative count of Article Views (full-text article views including HTML views, PDF and ePub downloads, according to the available data) and Abstracts Views on Vision4Press platform.
Data correspond to usage on the plateform after 2015. The current usage metrics is available 48-96 hours after online publication and is updated daily on week days.
Initial download of the metrics may take a while.