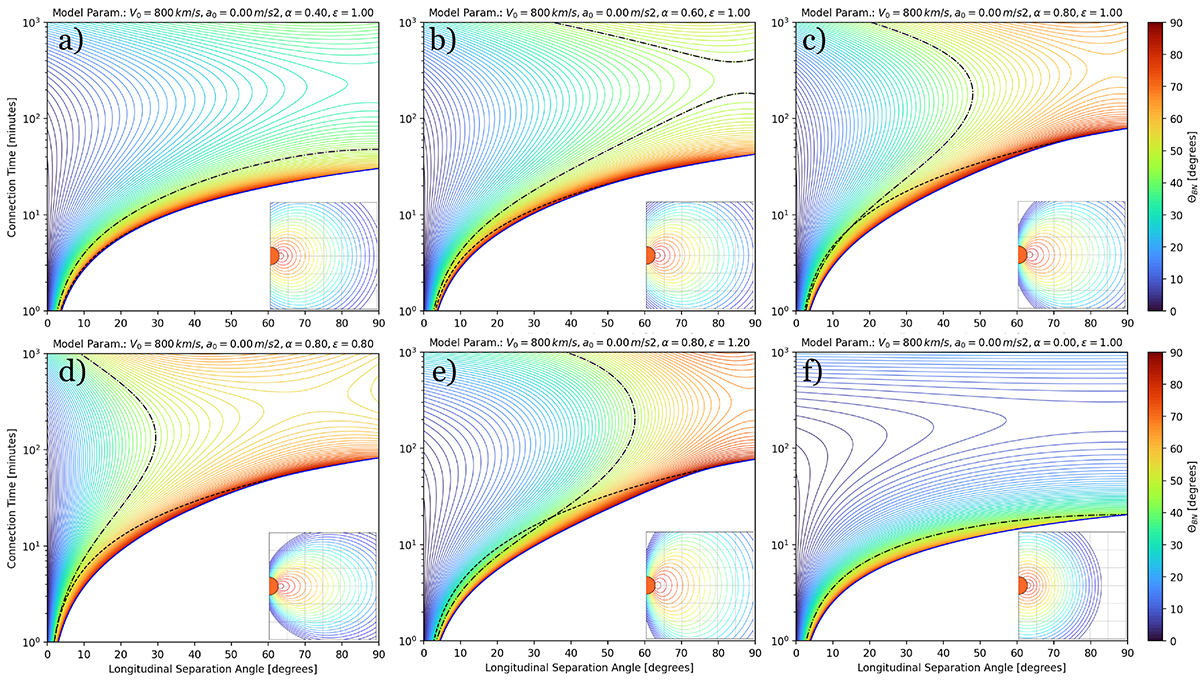
Fig. 5.
Download original image
Disturbance connection times as a function of the longitudinal separation angle from the eruption site for an expansion speed of 800 km s−1 and varying α values among the different panels. The blue curves show the times that the disturbance connects to field lines for the first time, the solid black curves show the time that the disturbance connects at the same field lines at the solar surface. The coloured curves show the connection times when the disturbance has a specific ΘBn at the connected field lines. The dashed black curves show the time when ΘBn = 45° (oblique geometry). For the calculation of ΘBn, we assumed that the field lines are Parker spirals (ΘBr ≠ 0°). The inset plot in each of the panels shows the propagating disturbance (coloured circles) for the different set of parameters used.
Current usage metrics show cumulative count of Article Views (full-text article views including HTML views, PDF and ePub downloads, according to the available data) and Abstracts Views on Vision4Press platform.
Data correspond to usage on the plateform after 2015. The current usage metrics is available 48-96 hours after online publication and is updated daily on week days.
Initial download of the metrics may take a while.