Fig. 2
Download original image
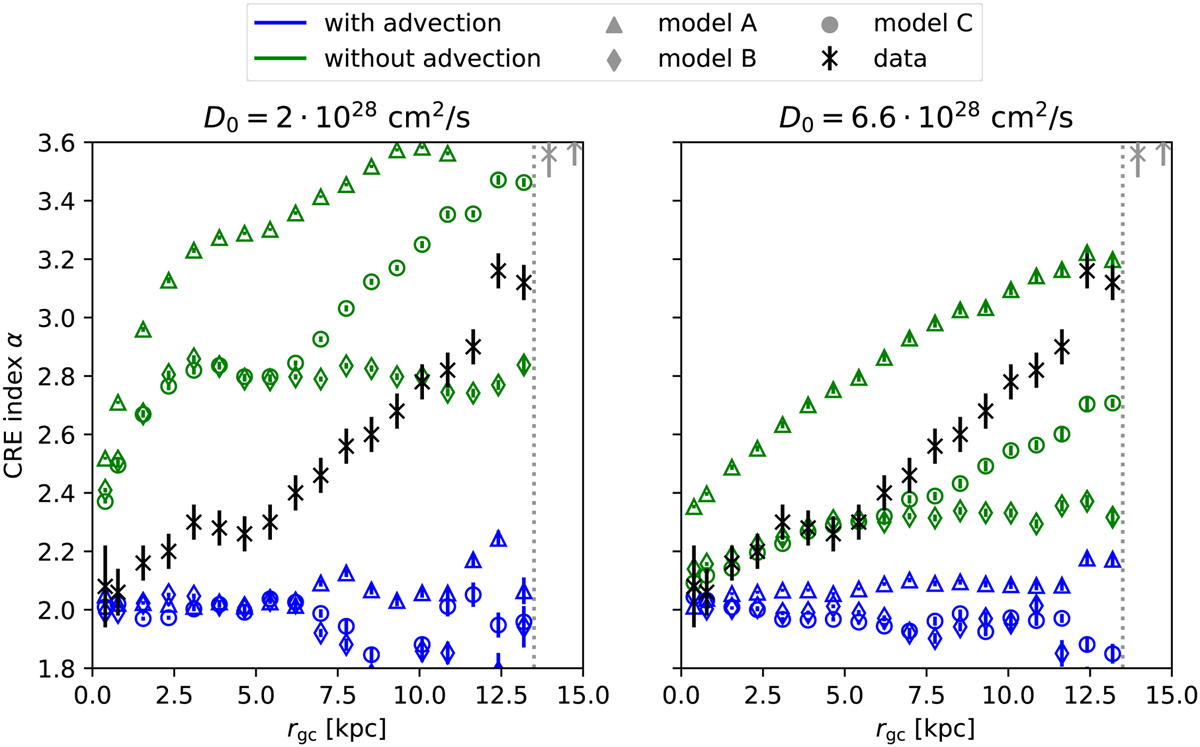
CRE spectral index as a function of the galactocentric radius. The left panel shows the simulation results using the measured diffusion coefficient from Heesen et al. (2019) and the right panel uses the best-fit value from Mulcahy et al. (2016). The model parameters are shown in Table 1. Green points indicate simulations without advection and blue point show those with advection. The data are taken from Heesen et al. (2019).
Current usage metrics show cumulative count of Article Views (full-text article views including HTML views, PDF and ePub downloads, according to the available data) and Abstracts Views on Vision4Press platform.
Data correspond to usage on the plateform after 2015. The current usage metrics is available 48-96 hours after online publication and is updated daily on week days.
Initial download of the metrics may take a while.