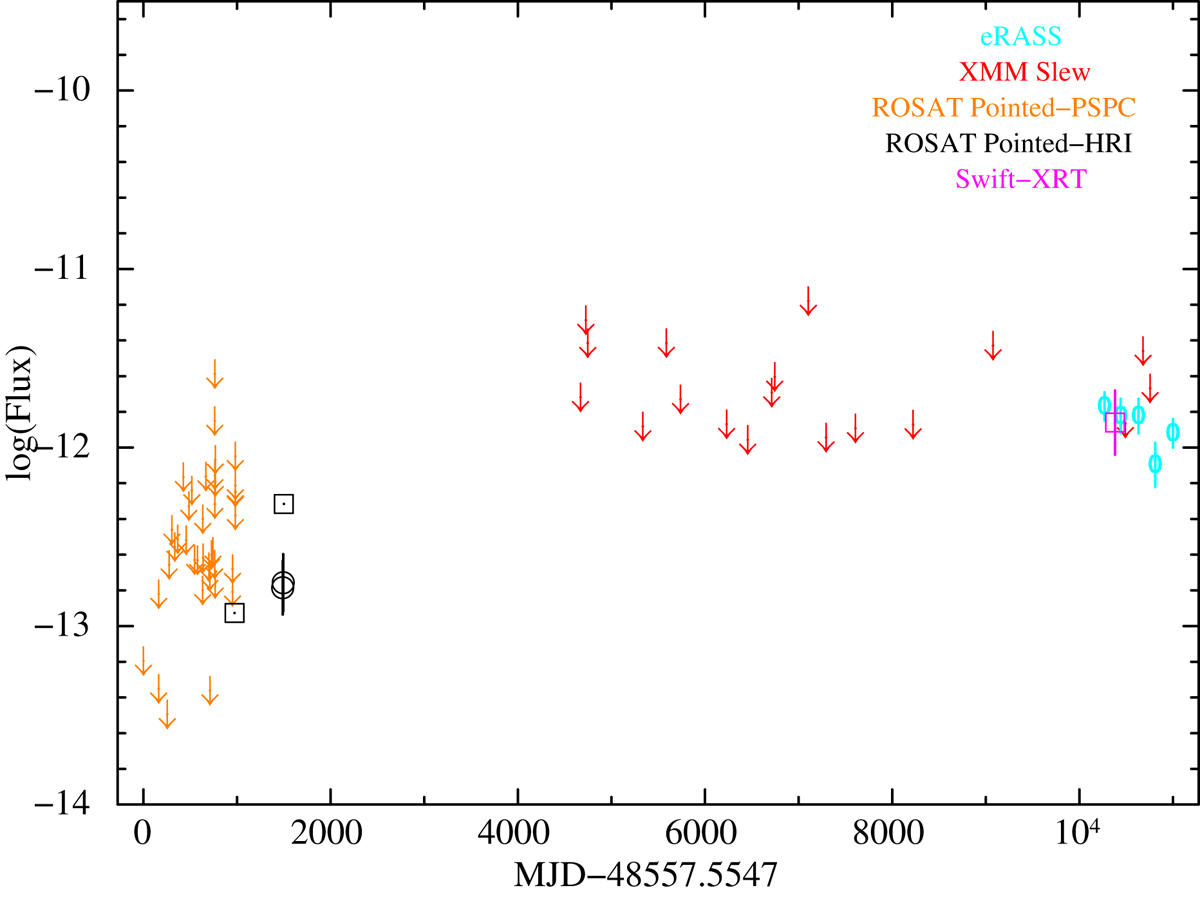
Fig. 6.
Download original image
Long-term X-ray light curve of eRASSU J052914.9−662446 in the energy range of 0.2–2 keV. Circles and ellipses represent the measured flux in units of erg cm−2 s−1, and the upper limits are shown as arrows. ROSAT PSPC, ROSAT HRI, XMM-Newton (slew), eROSITA, and Swift fluxes are shown in orange, black, blue, and cyan, and magenta, respectively. Flux values except for eROSITA measurements are derived using the High-Energy Lightcurve Generator.
Current usage metrics show cumulative count of Article Views (full-text article views including HTML views, PDF and ePub downloads, according to the available data) and Abstracts Views on Vision4Press platform.
Data correspond to usage on the plateform after 2015. The current usage metrics is available 48-96 hours after online publication and is updated daily on week days.
Initial download of the metrics may take a while.