Fig. 2.
Download original image
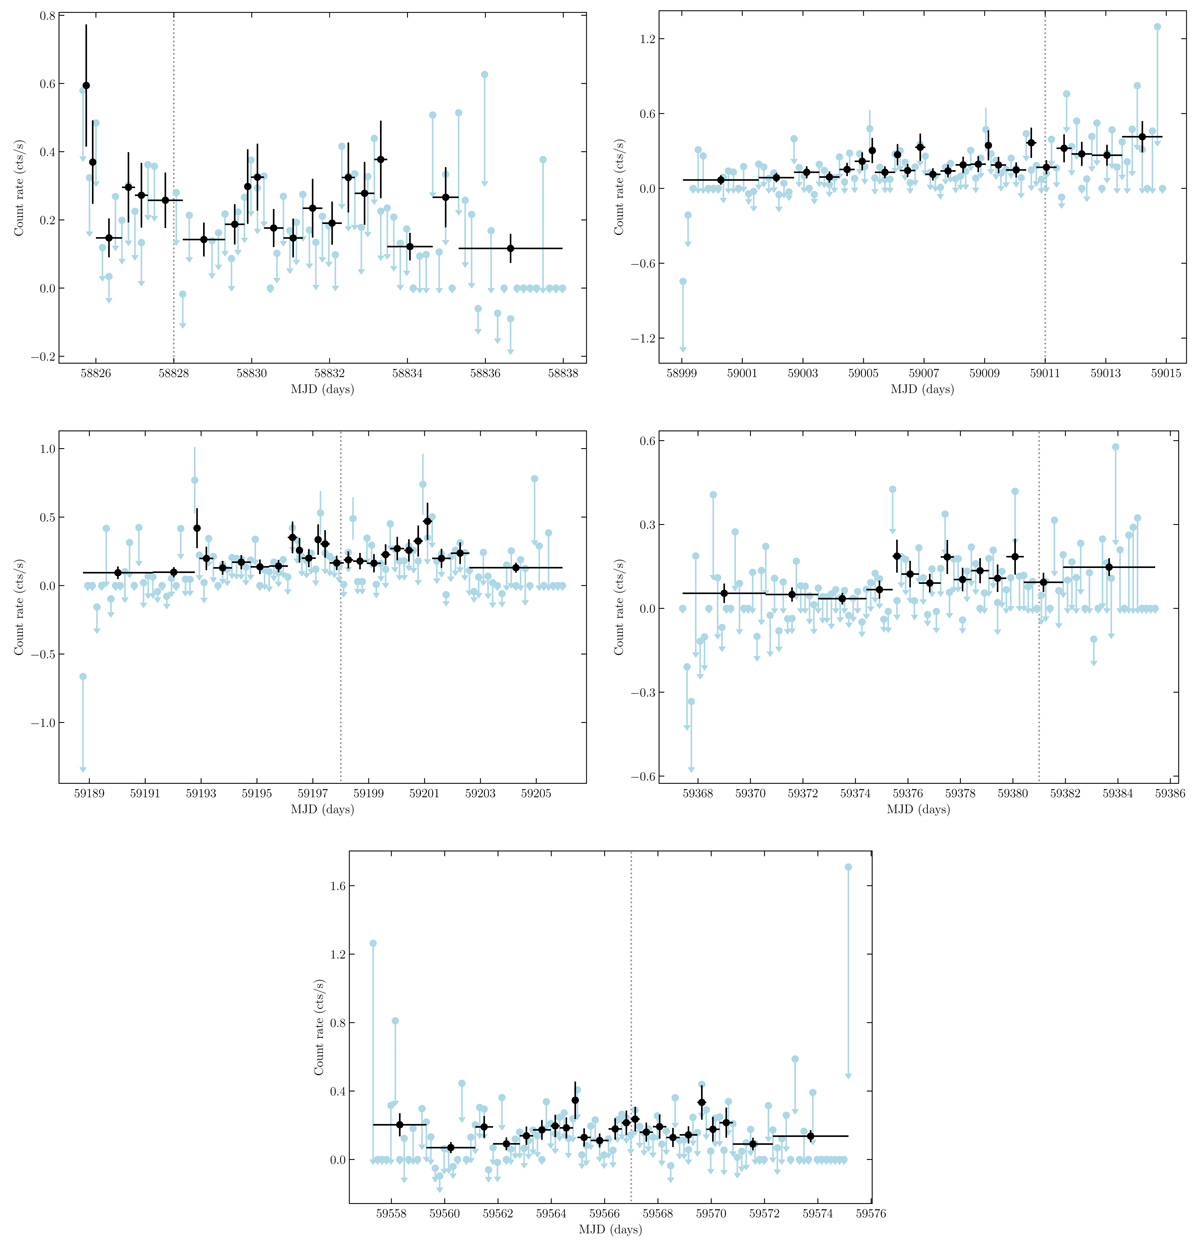
eROSITA light curves of eRASSU J052914.9−662446, where the blue points represent a single scan and the black points are rebinned to a minimum number of ten counts per bin for better statistical treatment. Error bars in the x-direction indicate time bins, and error bars in the y-direction show 1σ uncertainties assuming Poisson statistic. Count rates of bins with fewer thanten counts are plotted as 1σ upper limits. The dotted black lines indicate the formal transitions between different eRASSs. In light blue, we show the original observation pattern obtained by eROSITA. Light curves for epochs 1 (top left), 2 (top right), 3 (centre left), 4 (centre right), and 5 (bottom) are shown, as defined in Table 1.
Current usage metrics show cumulative count of Article Views (full-text article views including HTML views, PDF and ePub downloads, according to the available data) and Abstracts Views on Vision4Press platform.
Data correspond to usage on the plateform after 2015. The current usage metrics is available 48-96 hours after online publication and is updated daily on week days.
Initial download of the metrics may take a while.