Open Access
Fig. 10.
Download original image
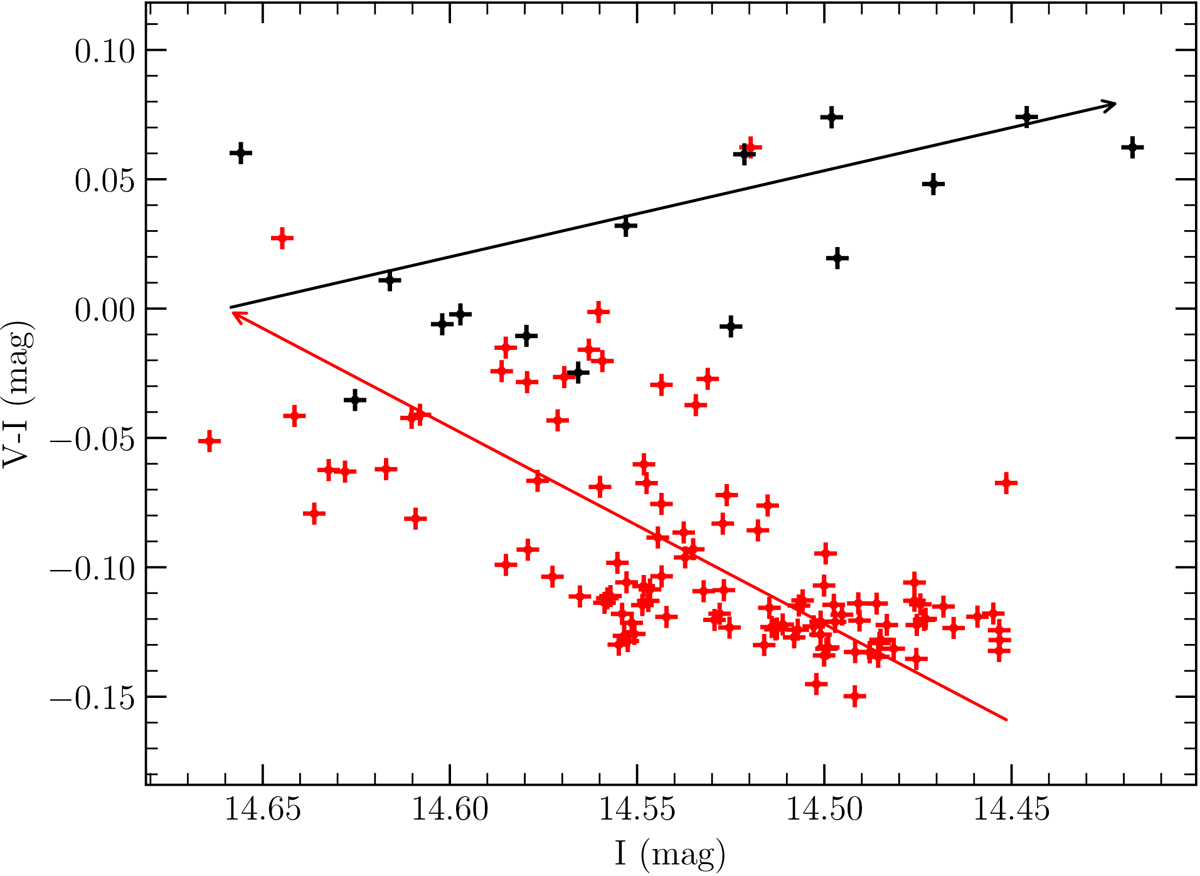
V − I colour index as derived for Fig. 9 as a function of I-band magnitude. Data taken before and after HJD 2456500 are marked in red and black, respectively. The arrows indicate the temporal evolution.
Current usage metrics show cumulative count of Article Views (full-text article views including HTML views, PDF and ePub downloads, according to the available data) and Abstracts Views on Vision4Press platform.
Data correspond to usage on the plateform after 2015. The current usage metrics is available 48-96 hours after online publication and is updated daily on week days.
Initial download of the metrics may take a while.